How to View Artwork Analytics
Overview
Artwork Views shows how buyers find and engage with your works, so you can see which pieces earn attention and where that attention comes from. It is for sellers — artists and galleries with published, listed works — who want to judge demand rather than guess. The page reports five totals for the visible date range (Total impressions, Total views, Views from AI Curator, Total added to cart, Total checkout opened), each with a change versus the previous period, plus a per-artwork table breaking the same funnel down by title. Source filters (AI Curator, Discover, Profile, Event, Private view, All sources) recompute every number to isolate one surface, such as marketplace browsing versus your public profile. Nothing here changes your listings — it is read-only reporting over the header date range. When you finish, you will know your totals, your best-performing artworks, and which surfaces drive your views and checkouts.
Before you start
- A Cohart seller account with published, listed artworks (see How to List Artworks in the Marketplace). Sign in with your email and password — draft or unpublished works collect no impressions, so the table can be empty on a brand-new account.
- Enough history for comparisons: a metric with no previous period shows “No prior comparison” instead of a percentage change, which is normal for new artworks.
- A note-taking habit for comparisons: there is no side-by-side view, so record the numbers per filter click — every figure on the page belongs to the header date range, with no per-row dates.
- Expect read-only effects only: filtering and paging never modify your artworks or listings. If the page seems stale after a click, wait a moment for the totals and rows to reload.
Steps
1. Sign in to Cohart
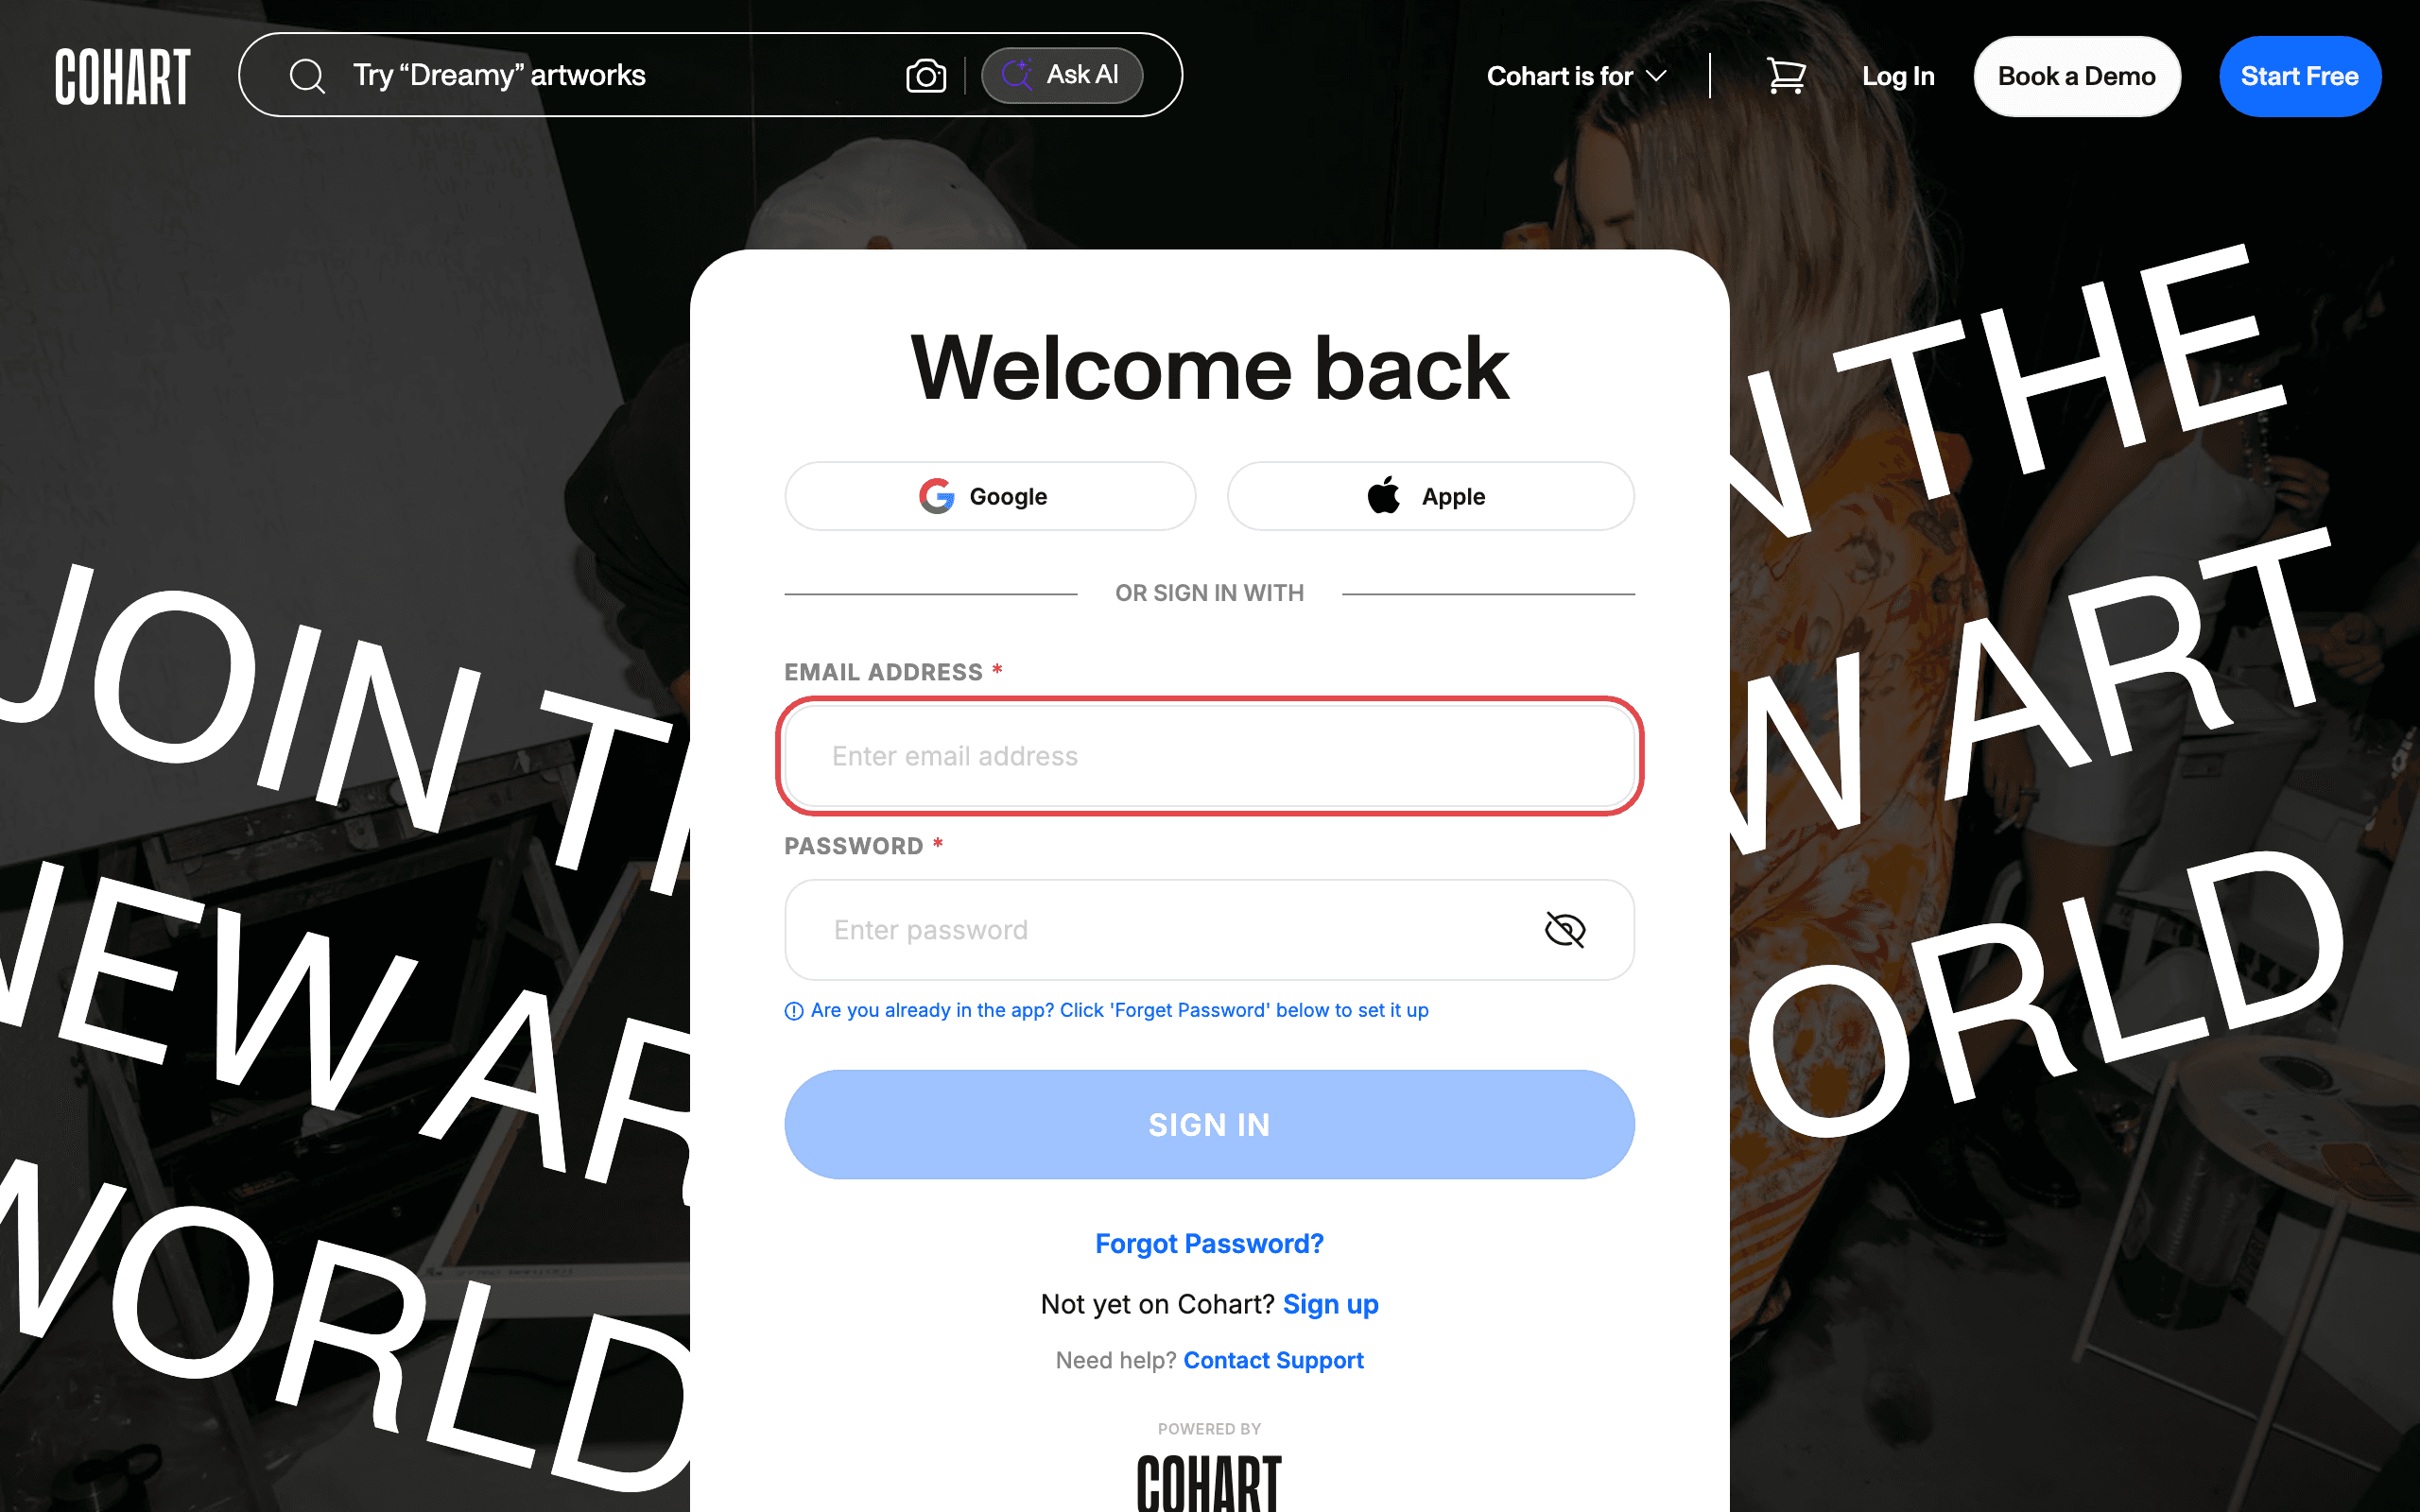
Sign in with your email address and password, or use Google or Apple.
2. Open Artwork Views
After sign-in you land on Inventory. In the left sidebar, below Admin and above Manage Plan, click Artwork Views.
3. Read the totals
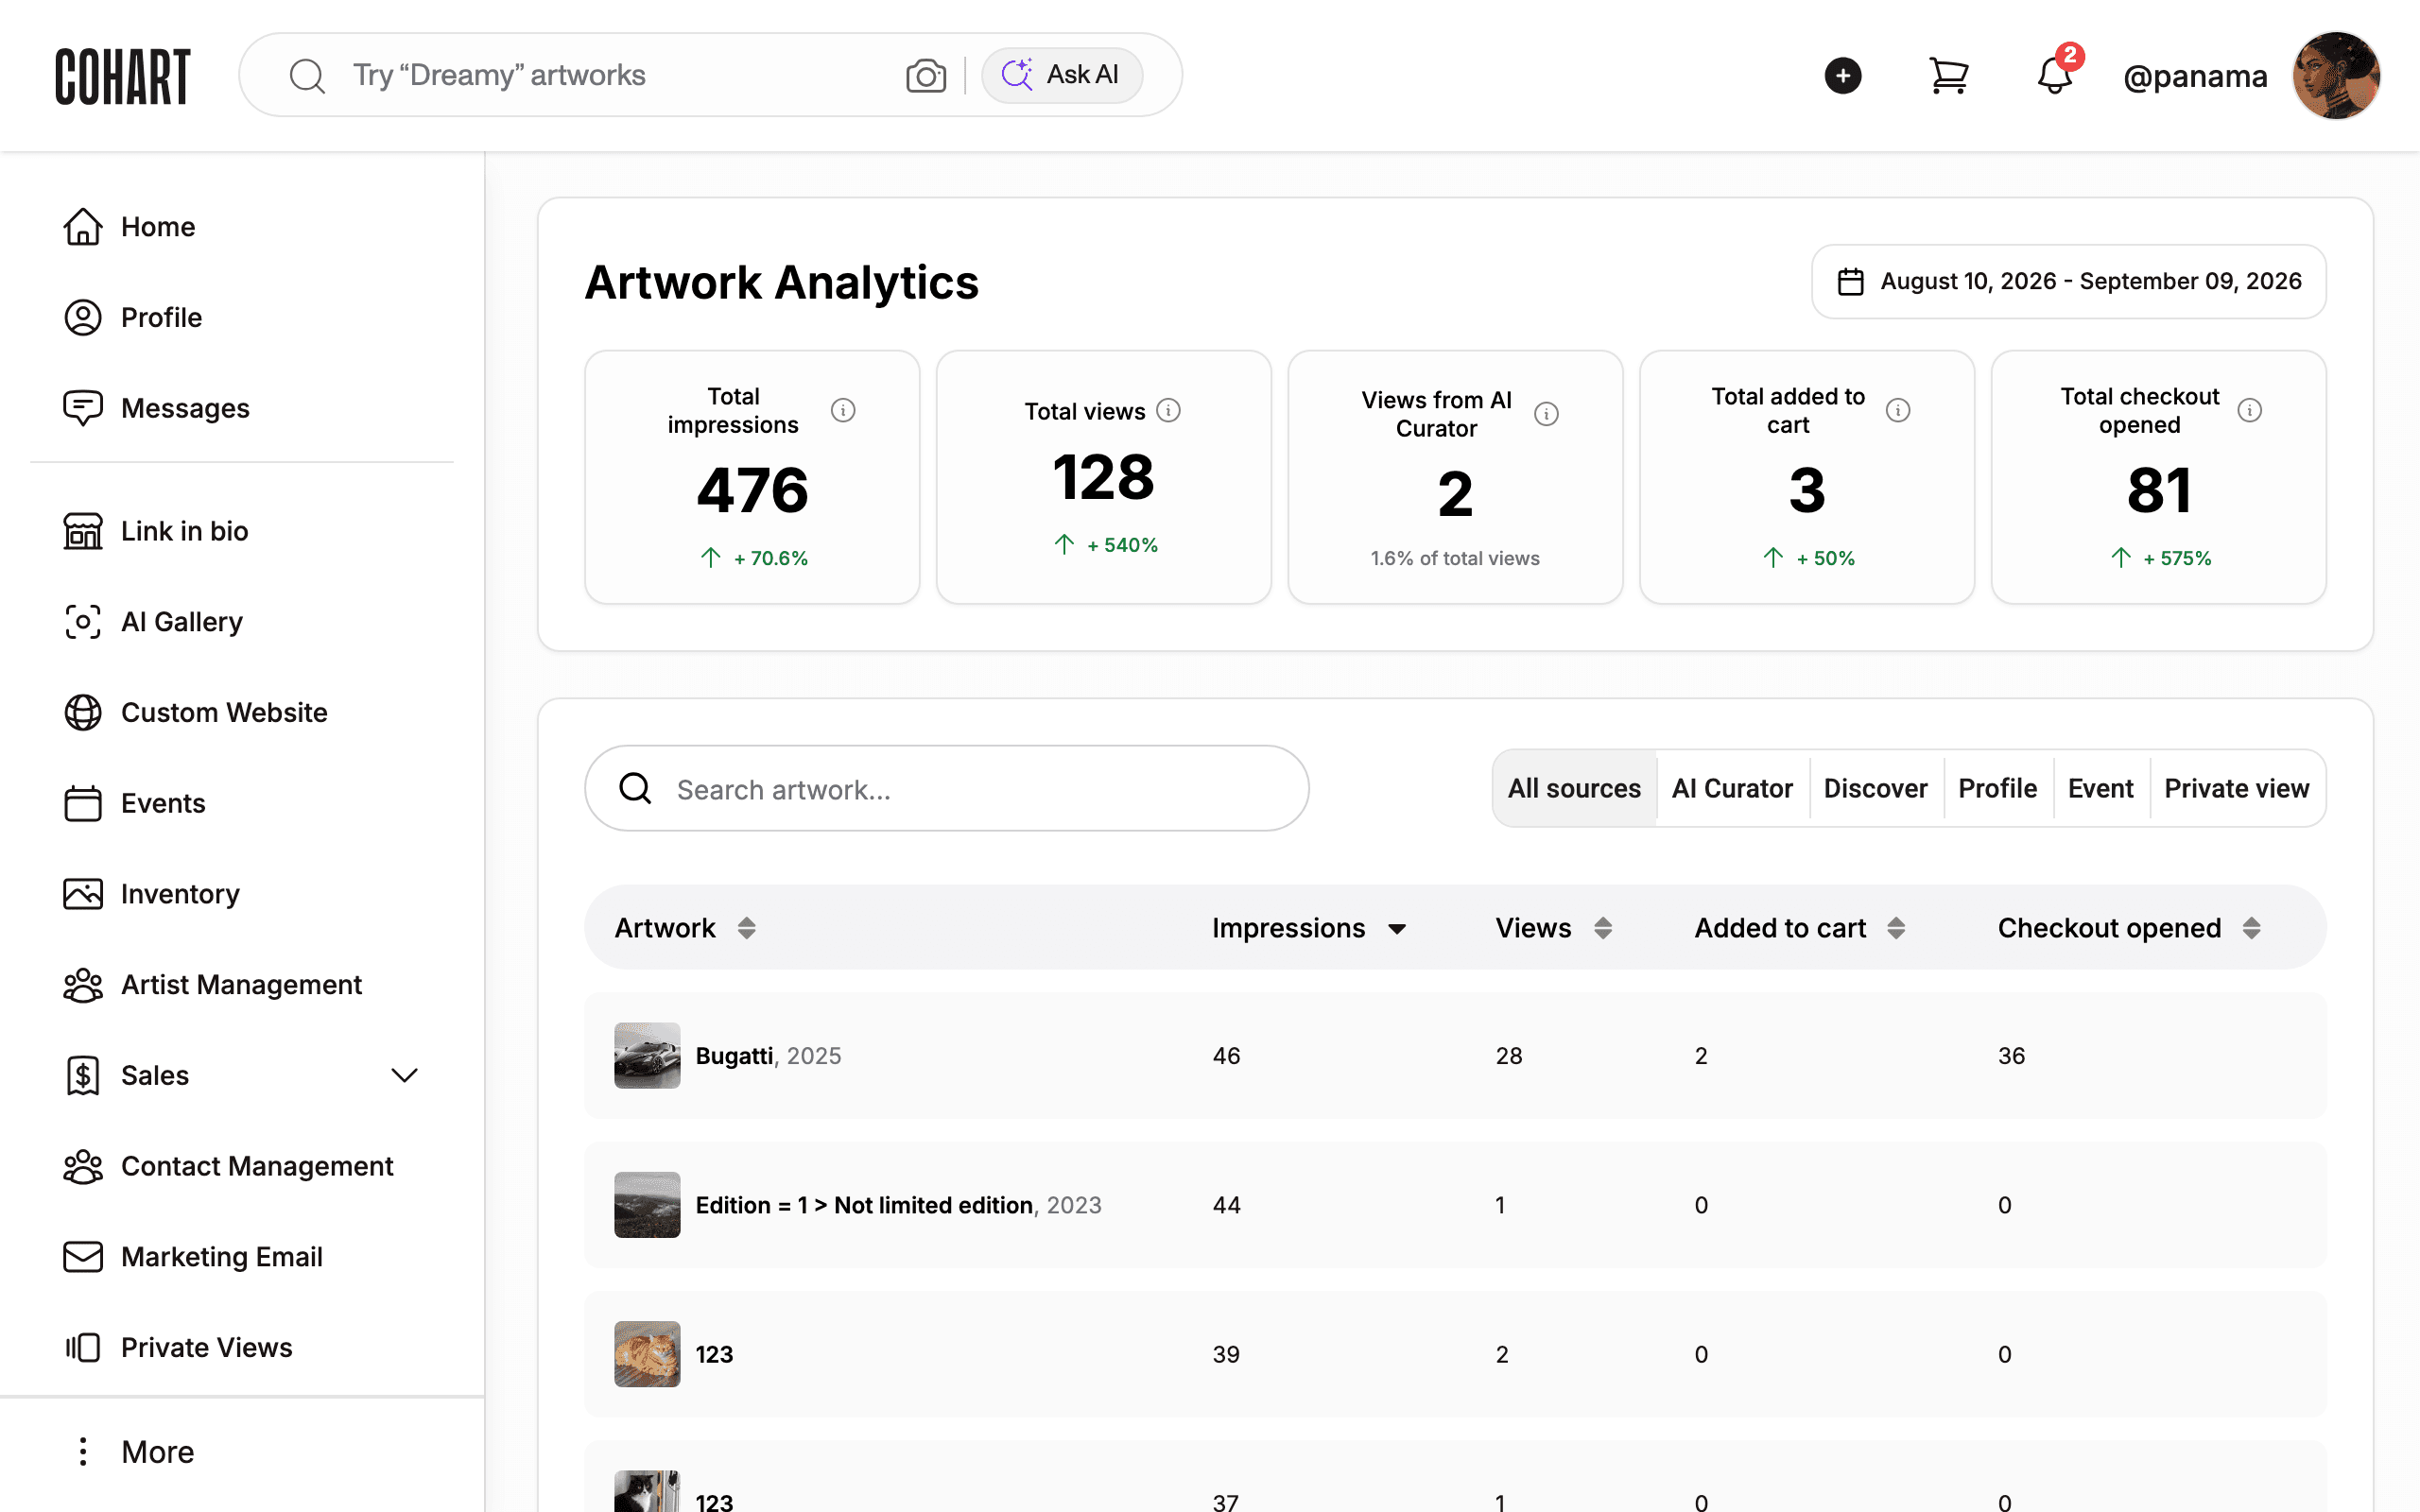
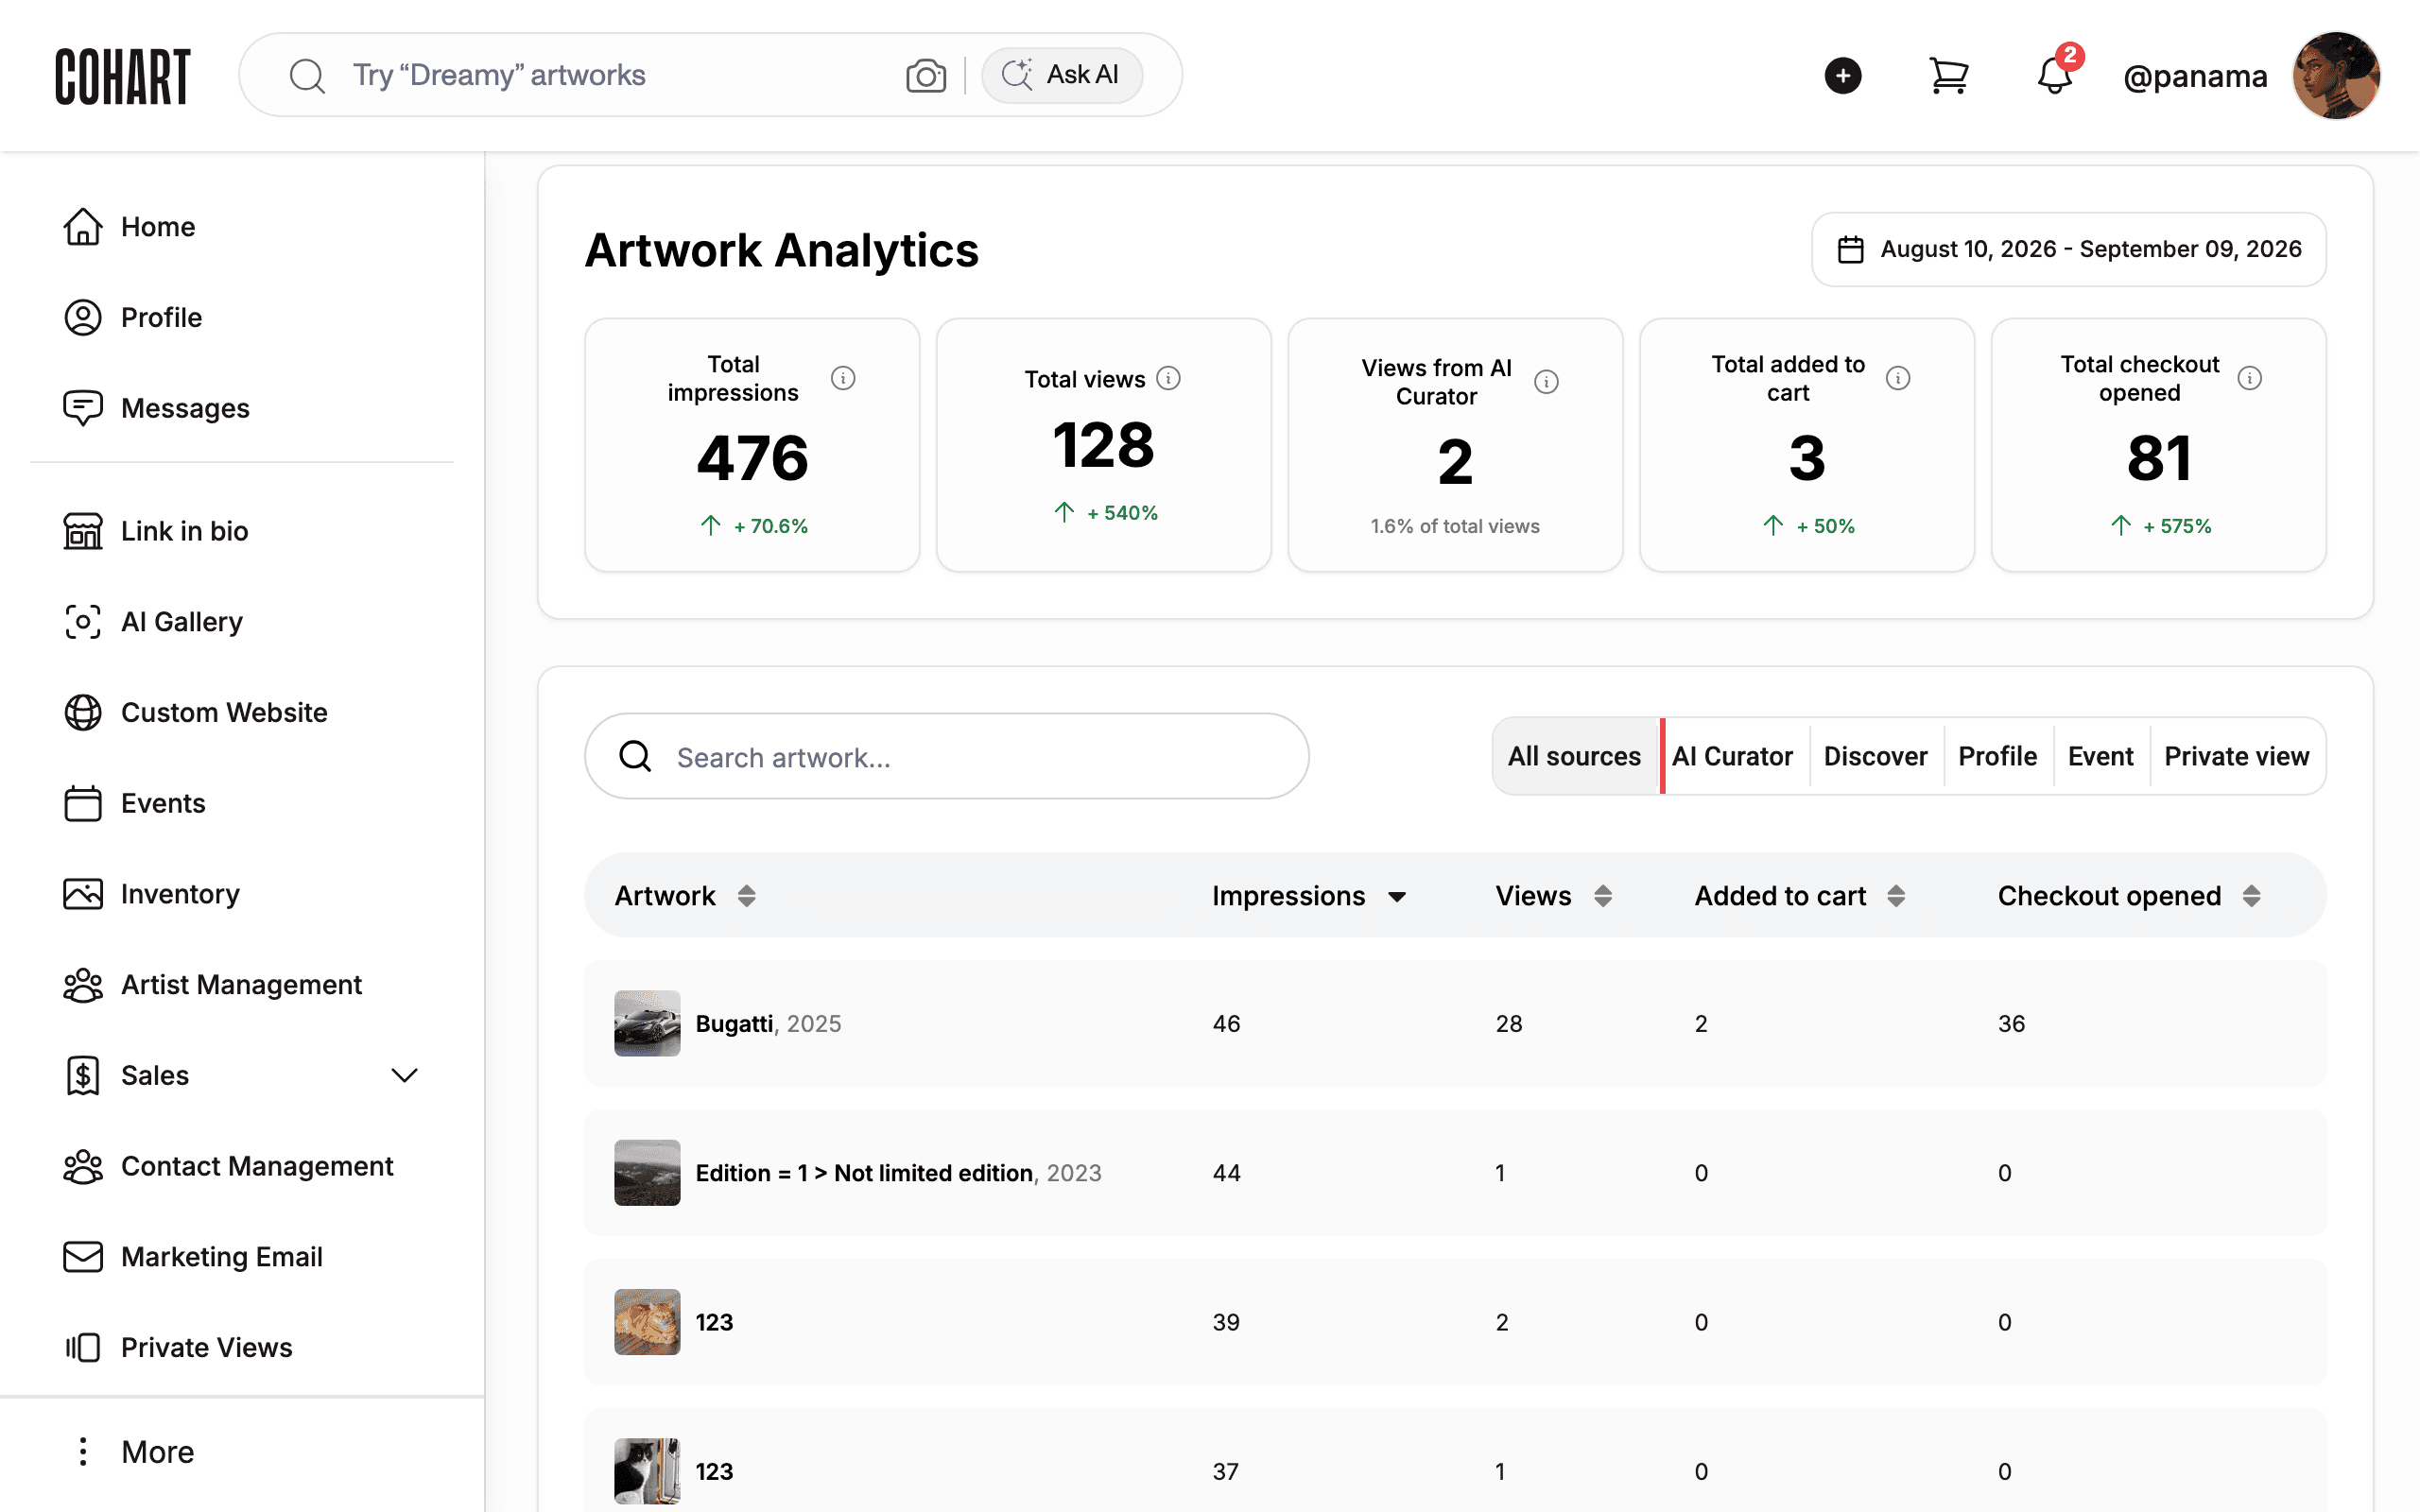
The Artwork Analytics page header shows five totals for the period: Total impressions, Total views, Views from AI Curator (with its share of total views), Total added to cart, and Total checkout opened. Each total carries a % change versus the previous period (for example Total impressions 476, +70.6%).
4. Check the reporting date range
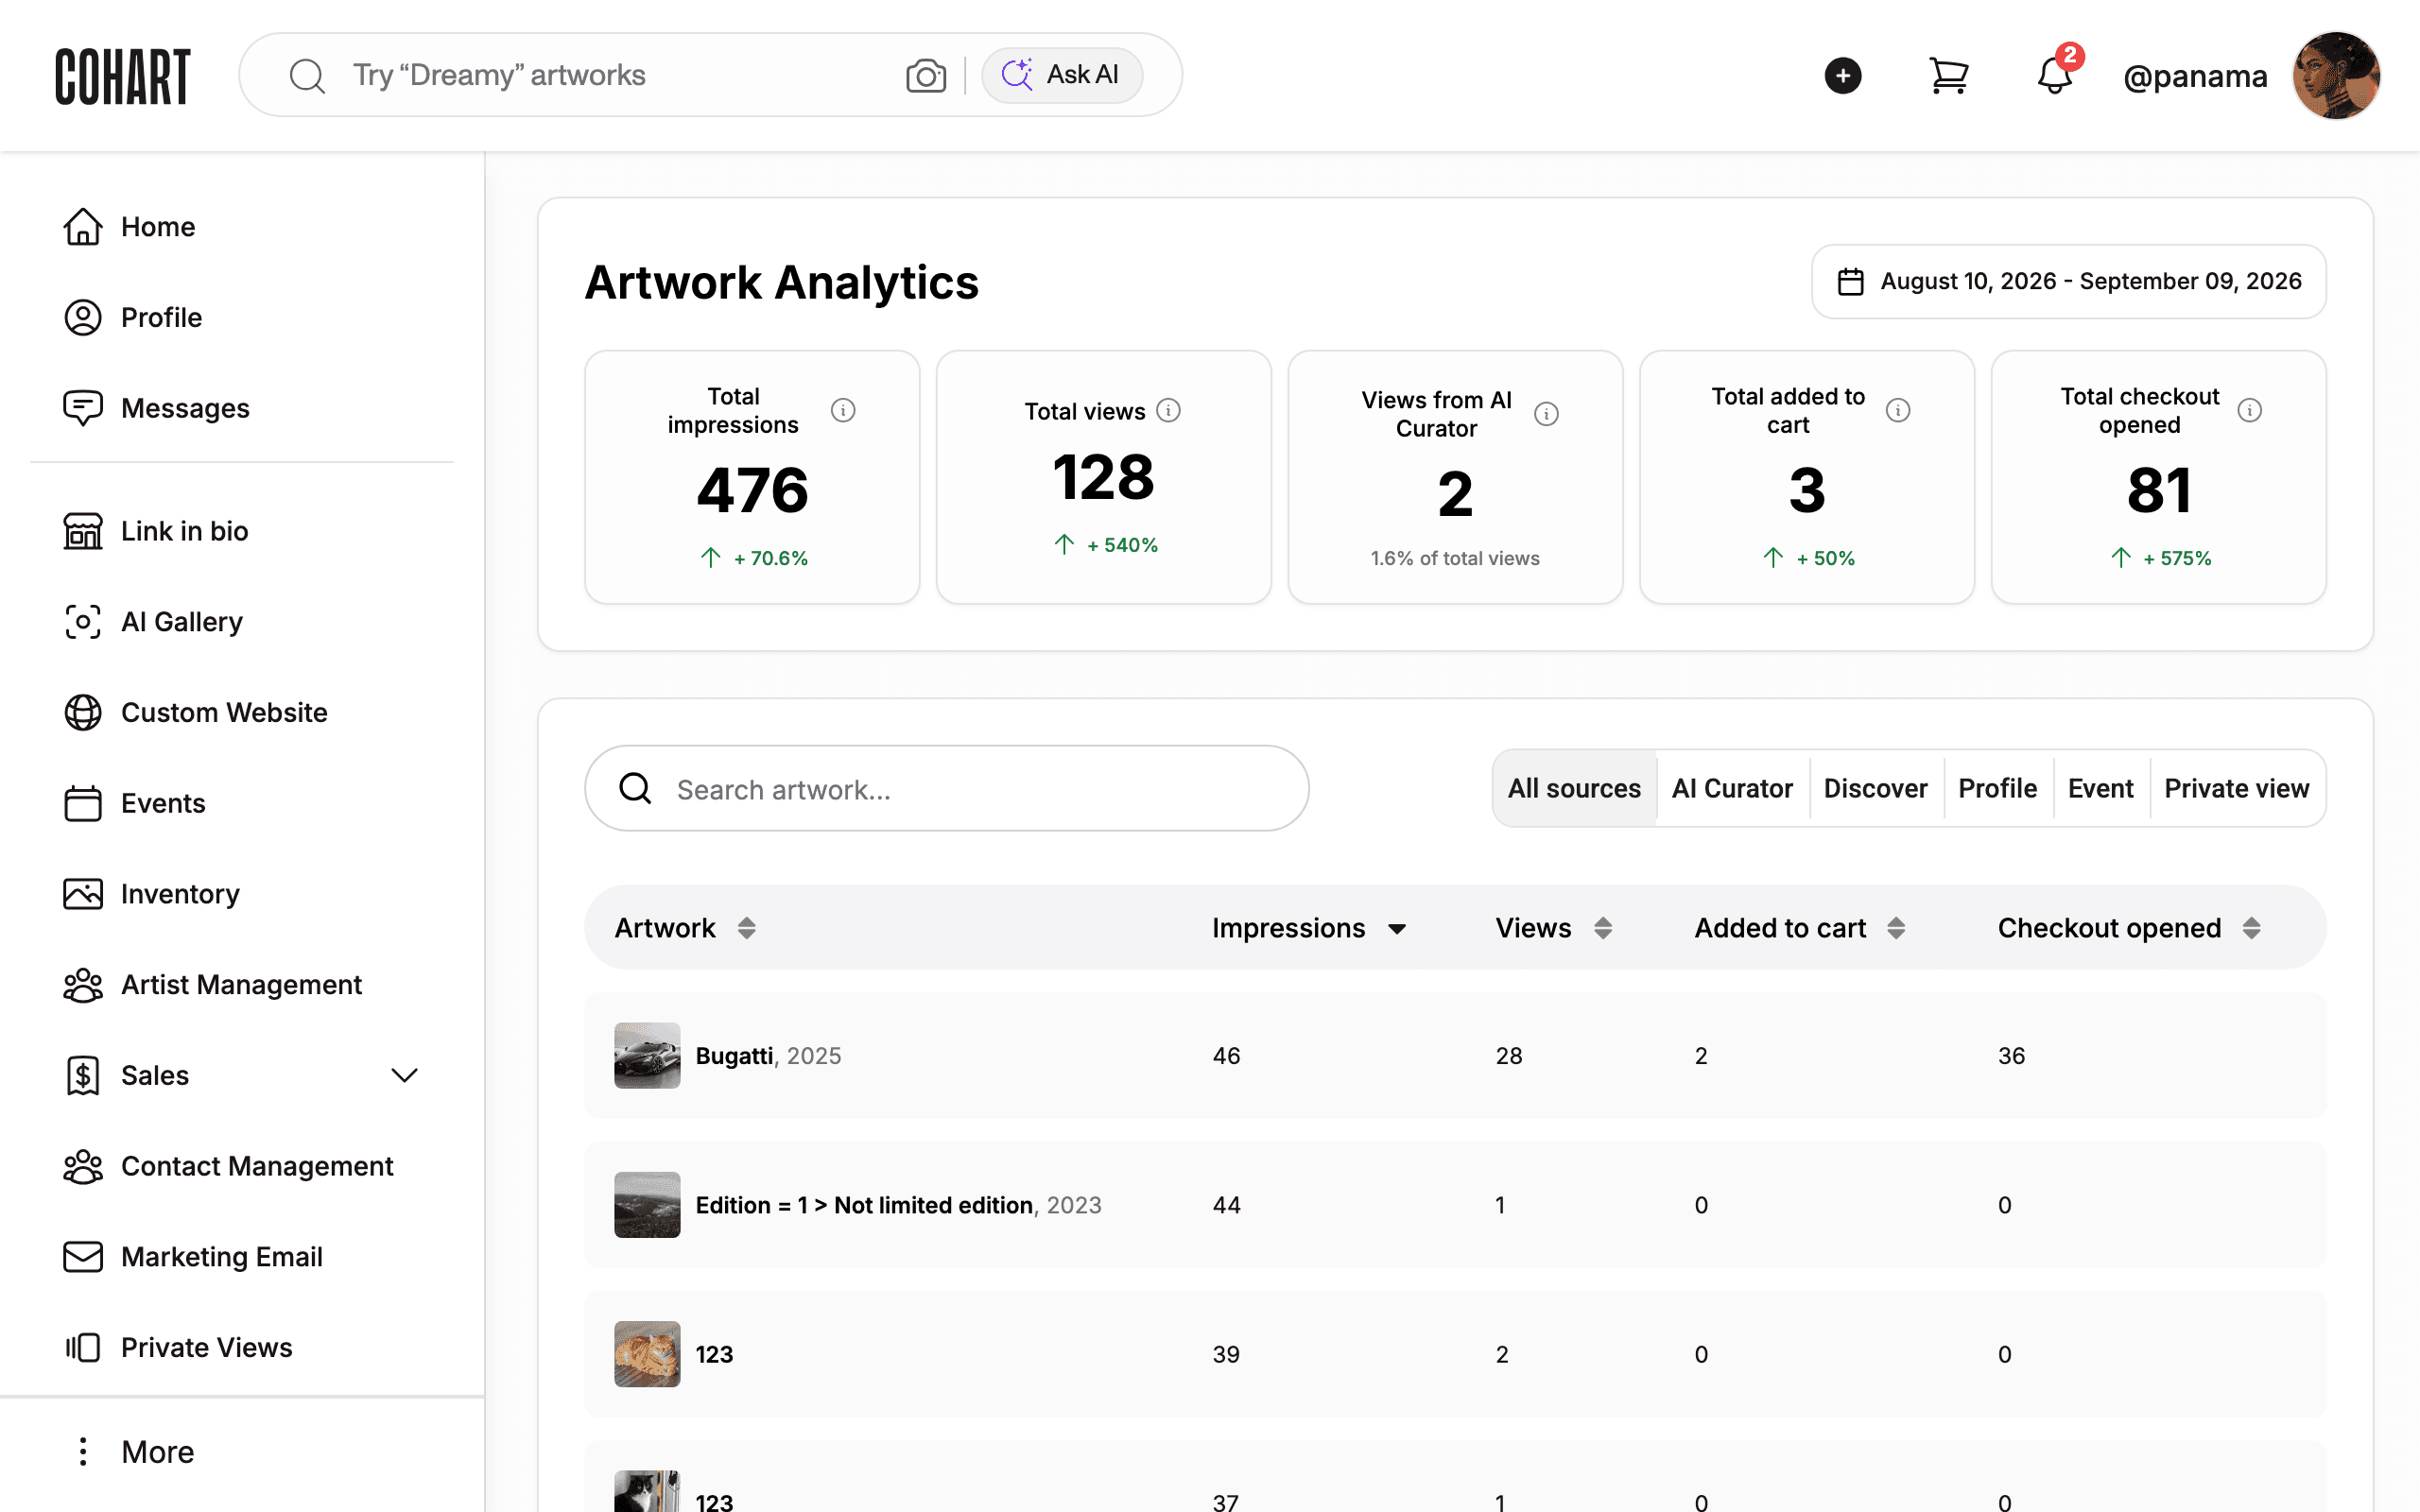
Check the reporting date range next to the title (for example August 10, 2026 - September 09, 2026). All totals and table rows reflect exactly this window.
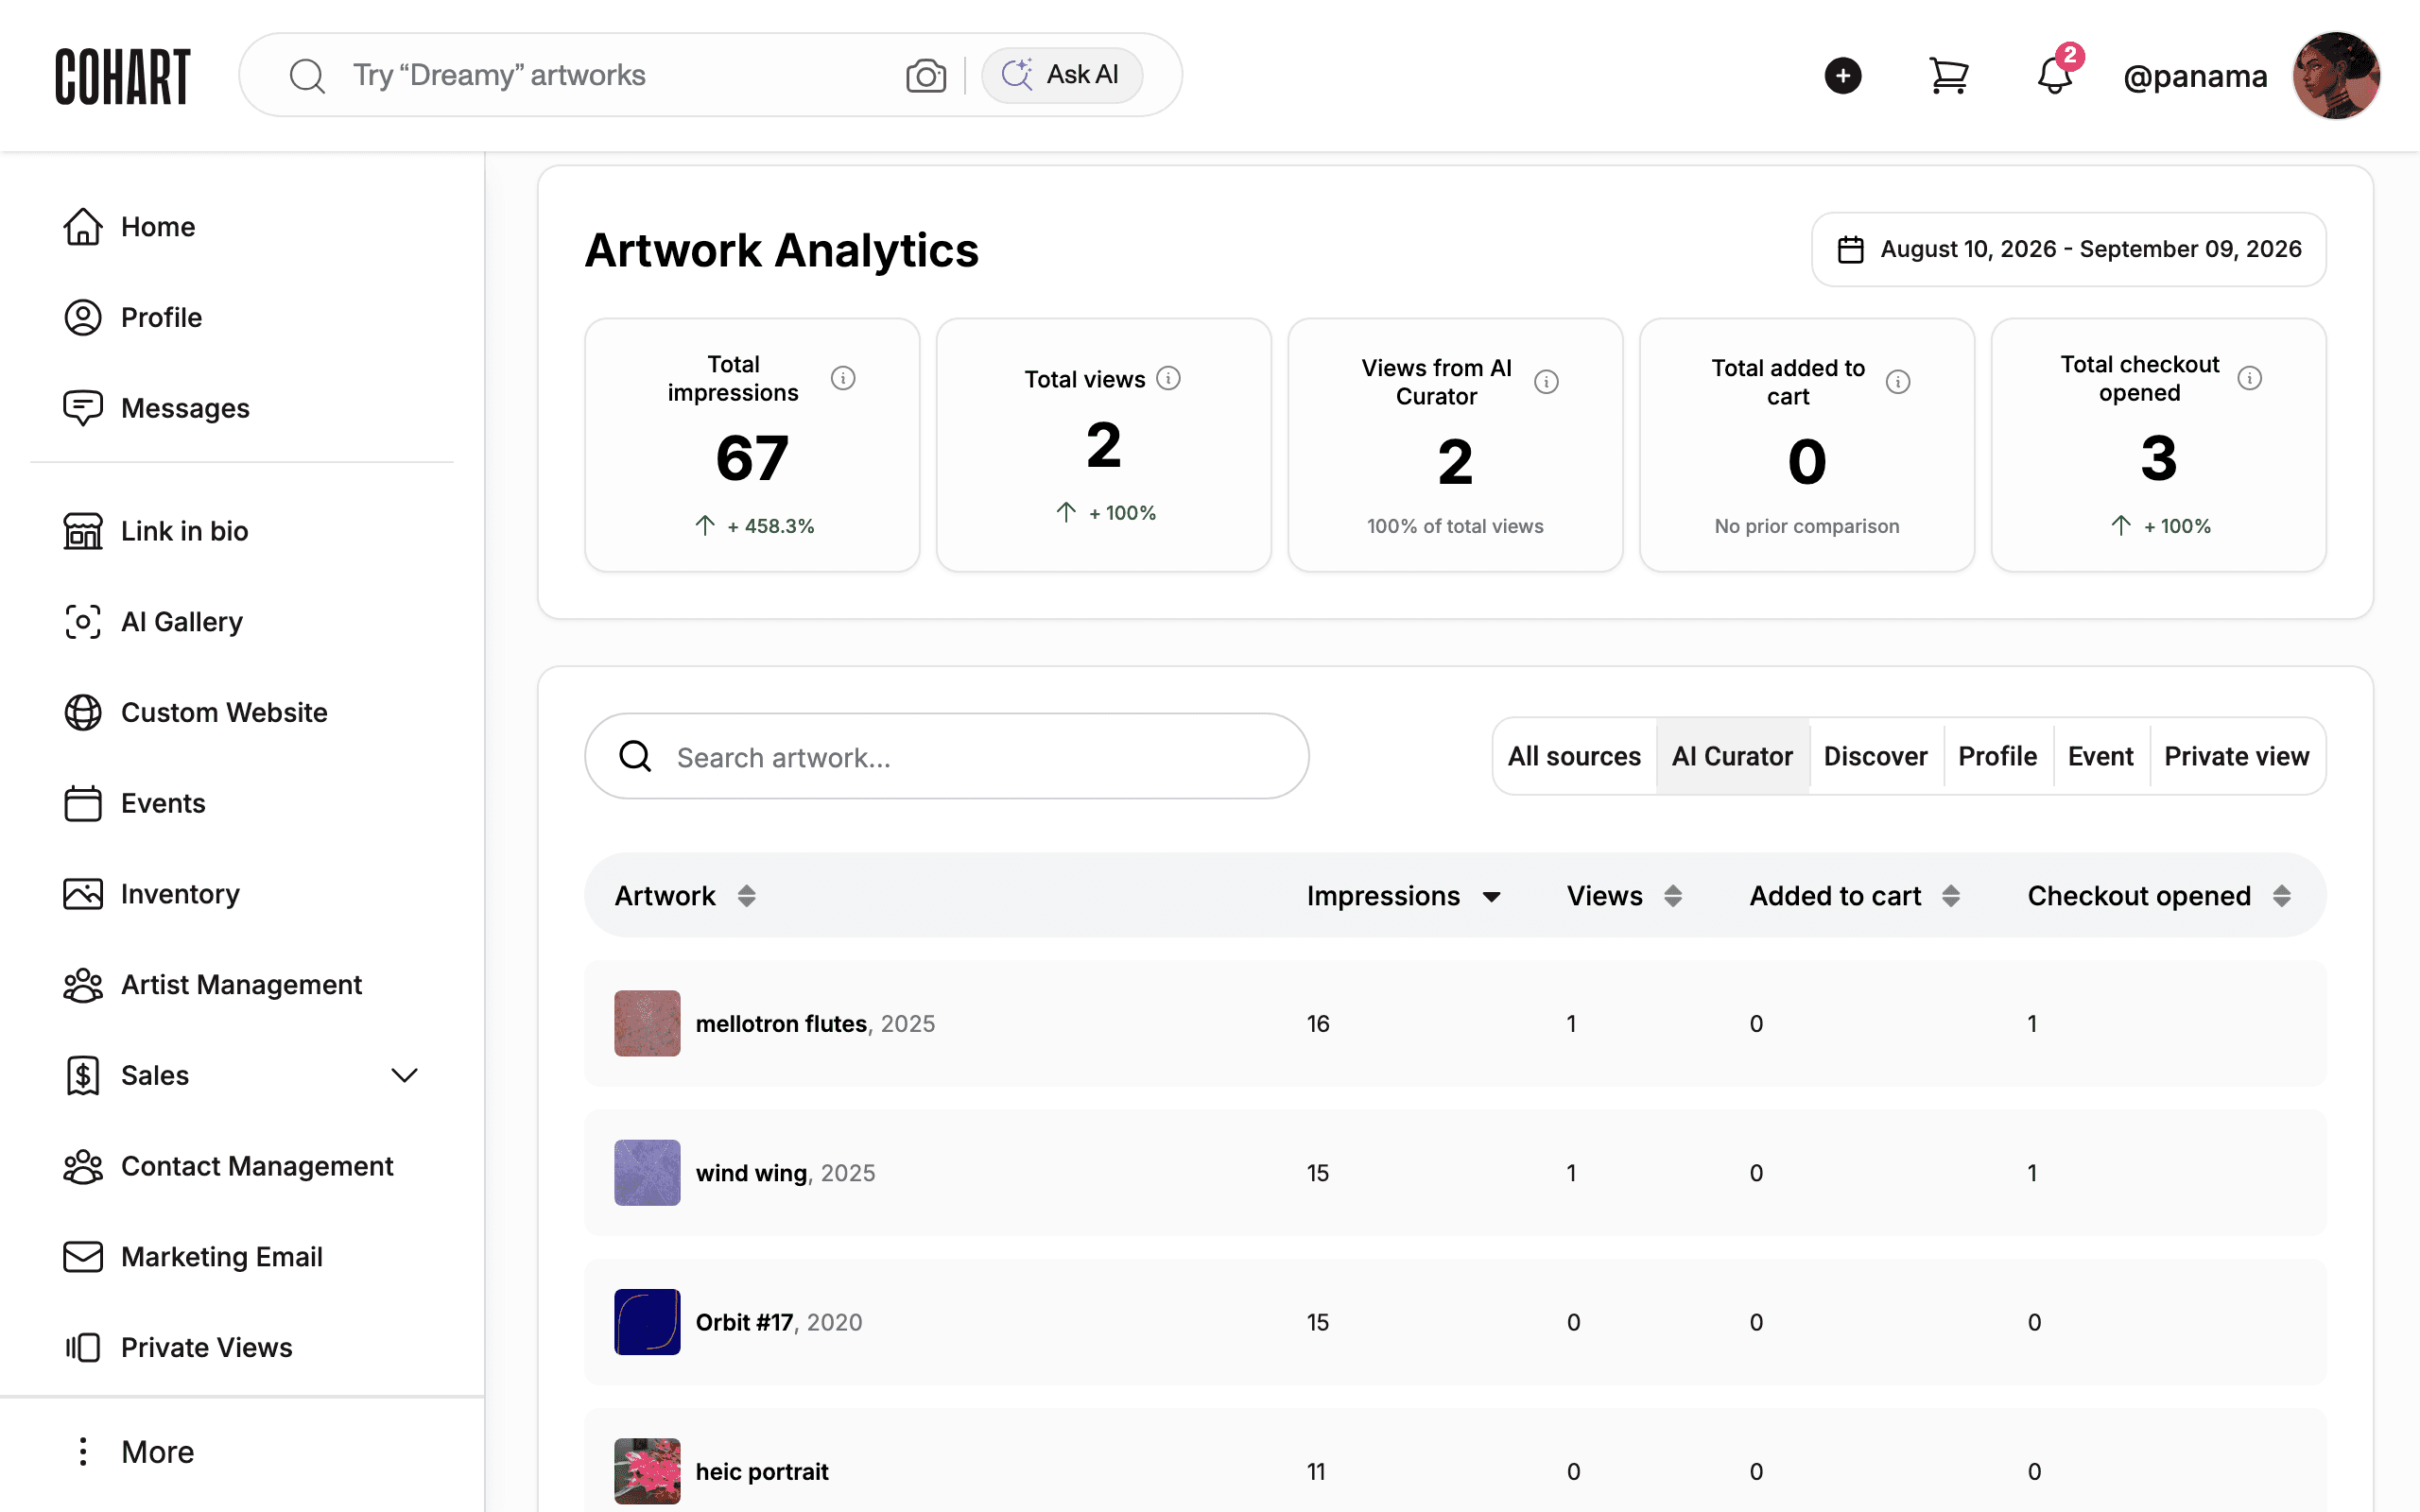
5. Filter by the AI Curator source
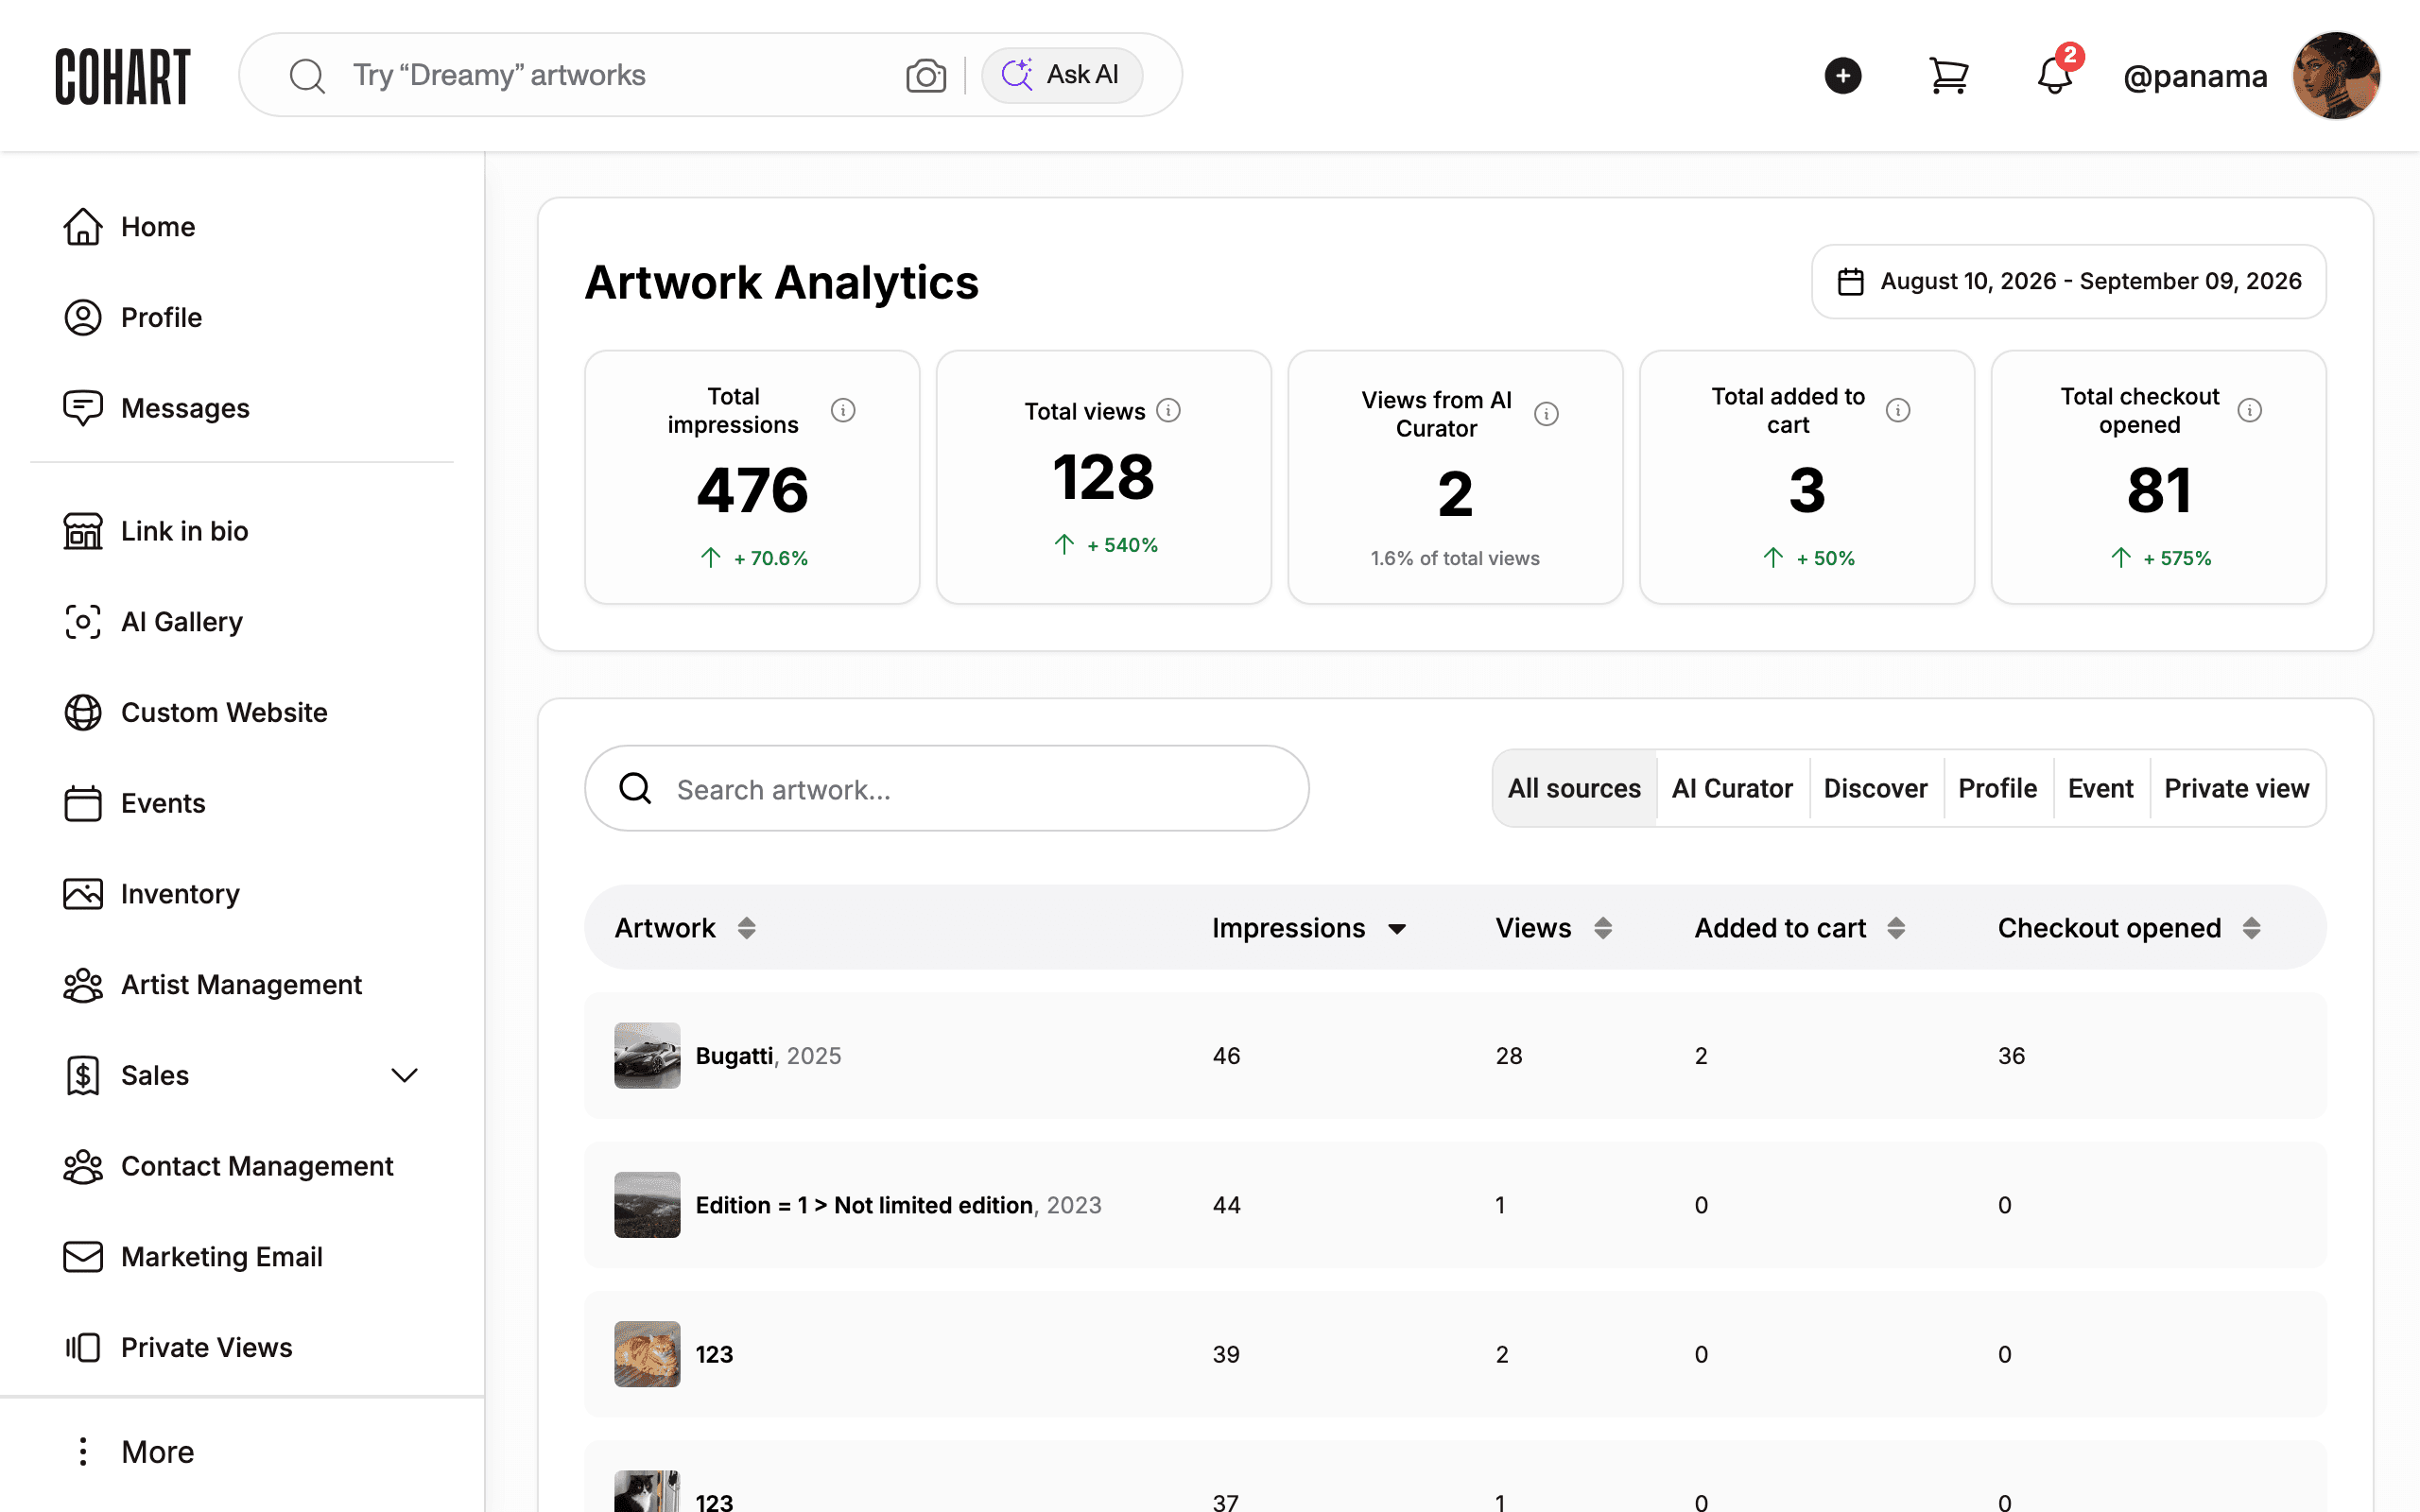
Click the AI Curator source filter. The totals recompute for that surface only: the header confirms with Views from AI Curator 2, 100% of total views, and the table narrows to artworks seen through the AI curator.
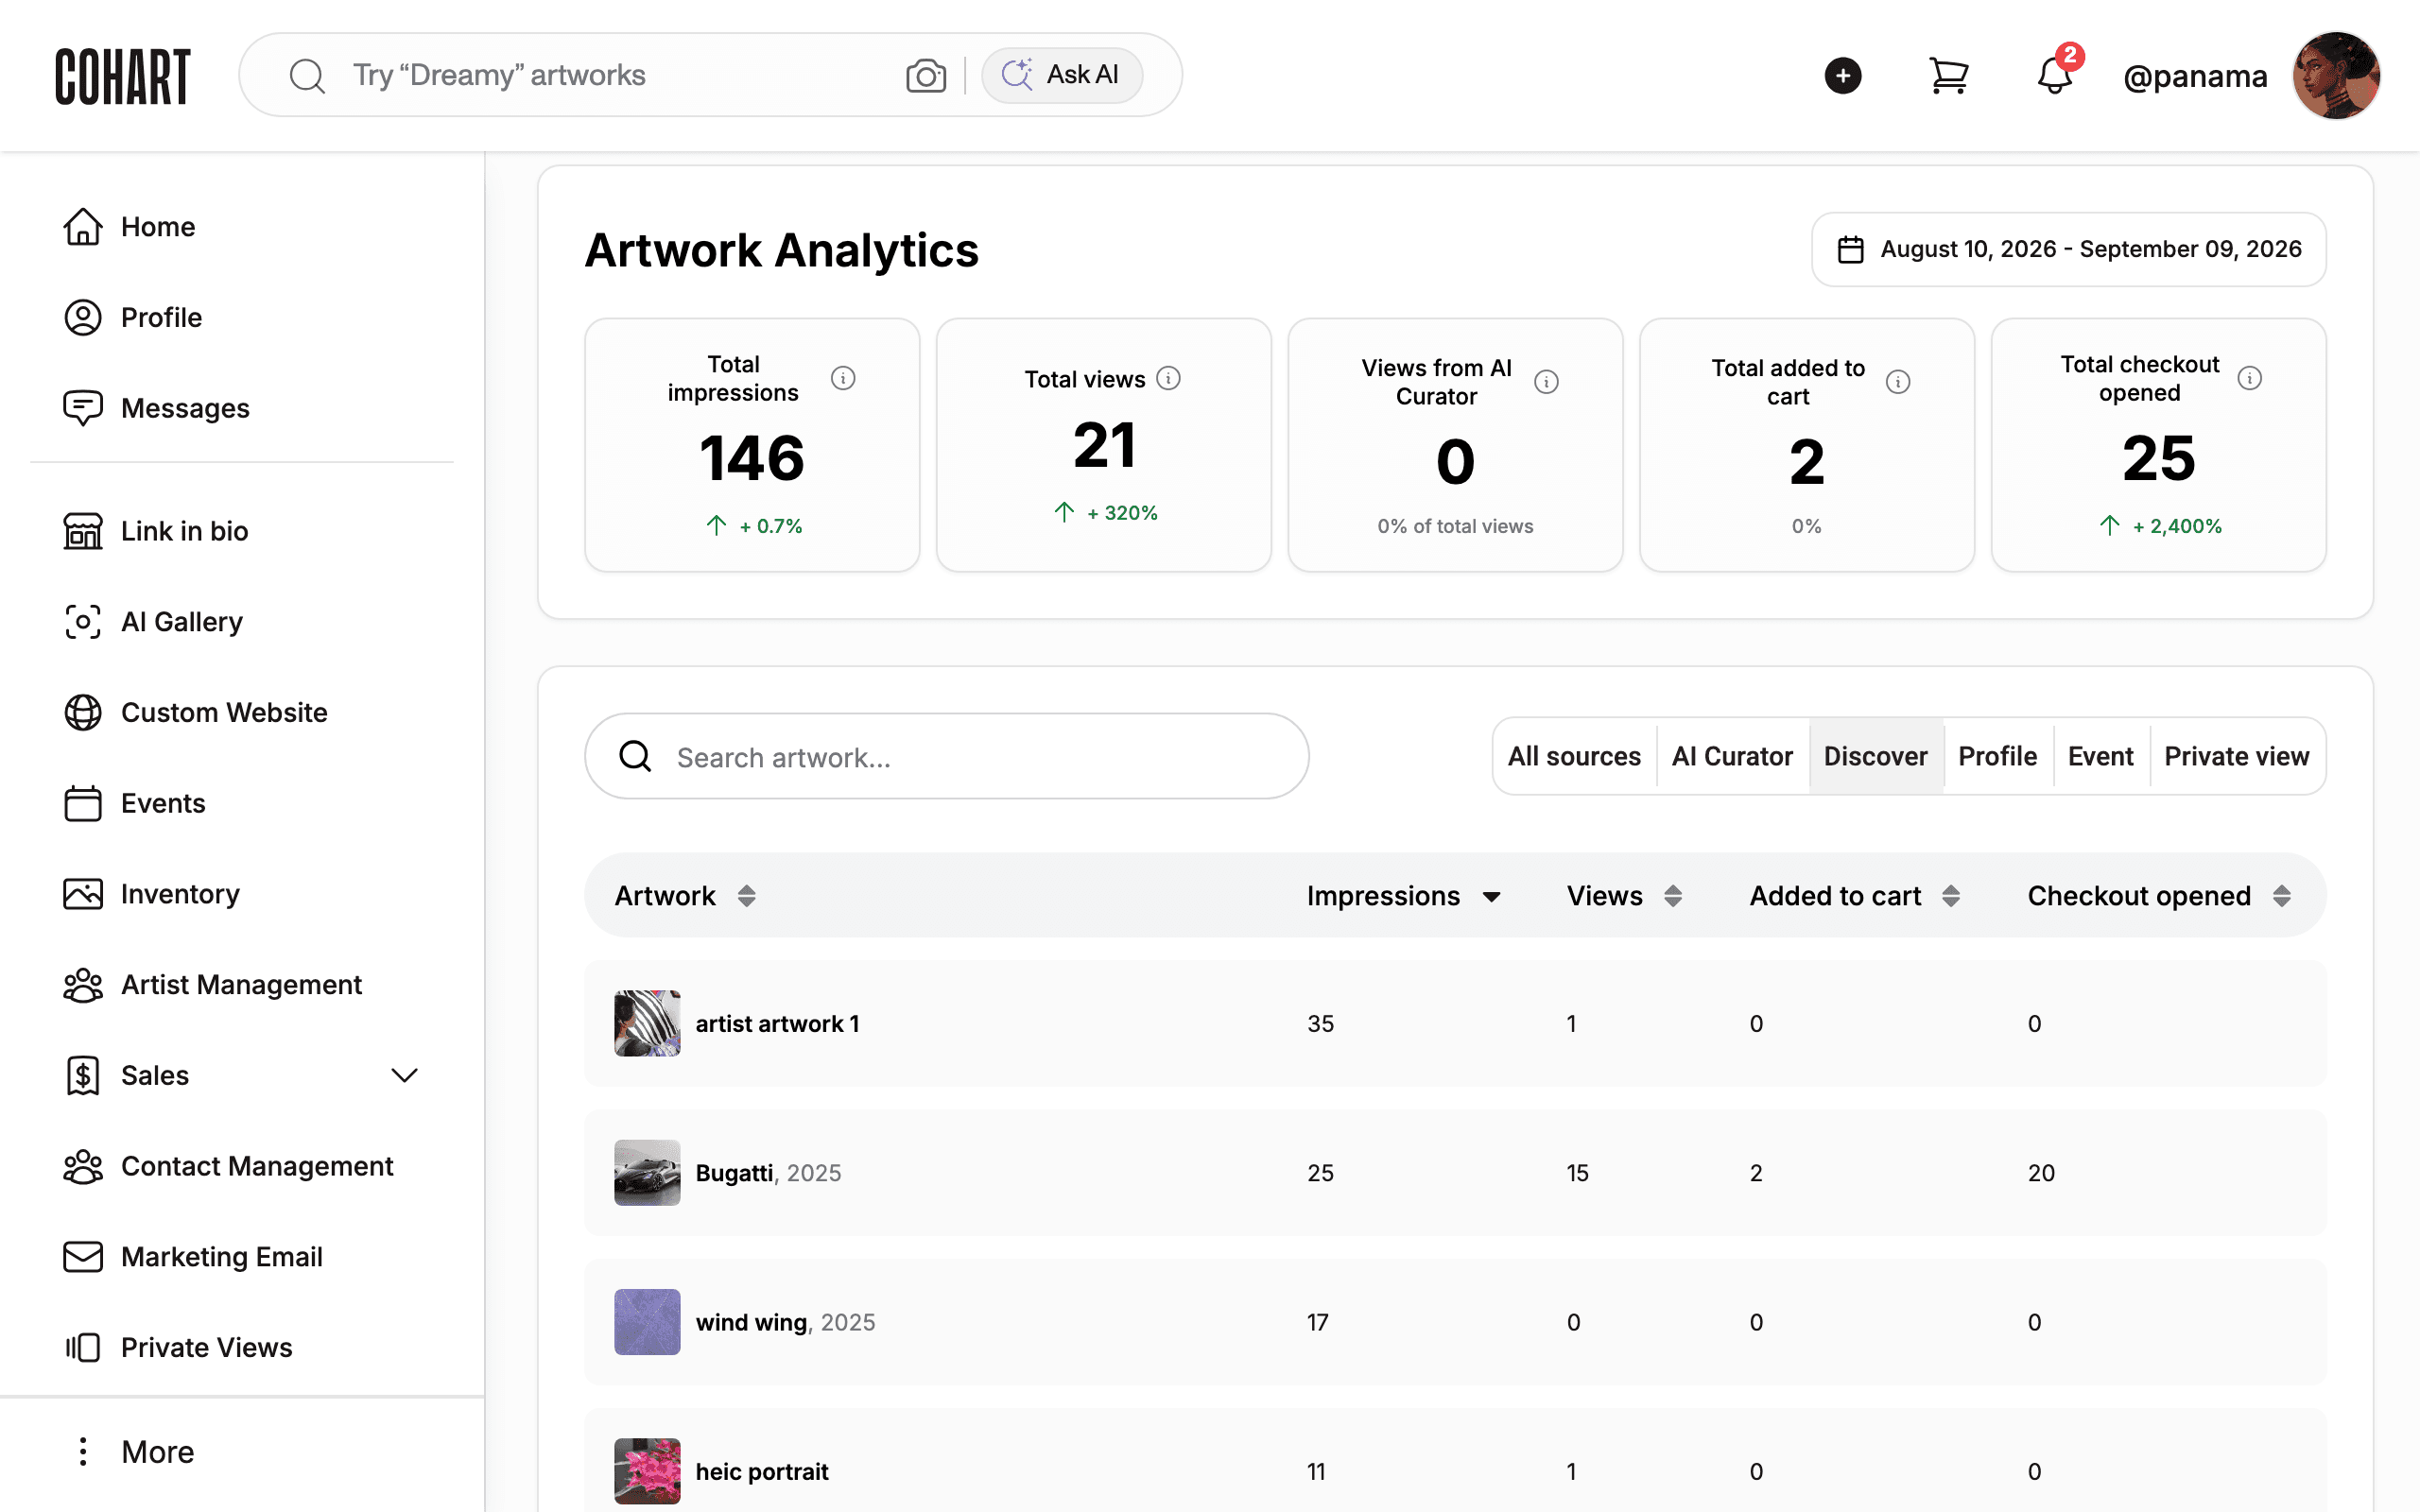
6. Filter by the Discover source
Click the Discover source filter. Totals change again (for example Total impressions 146, Total views 21, Total checkout opened 25), showing demand that came from marketplace browsing rather than the curator.
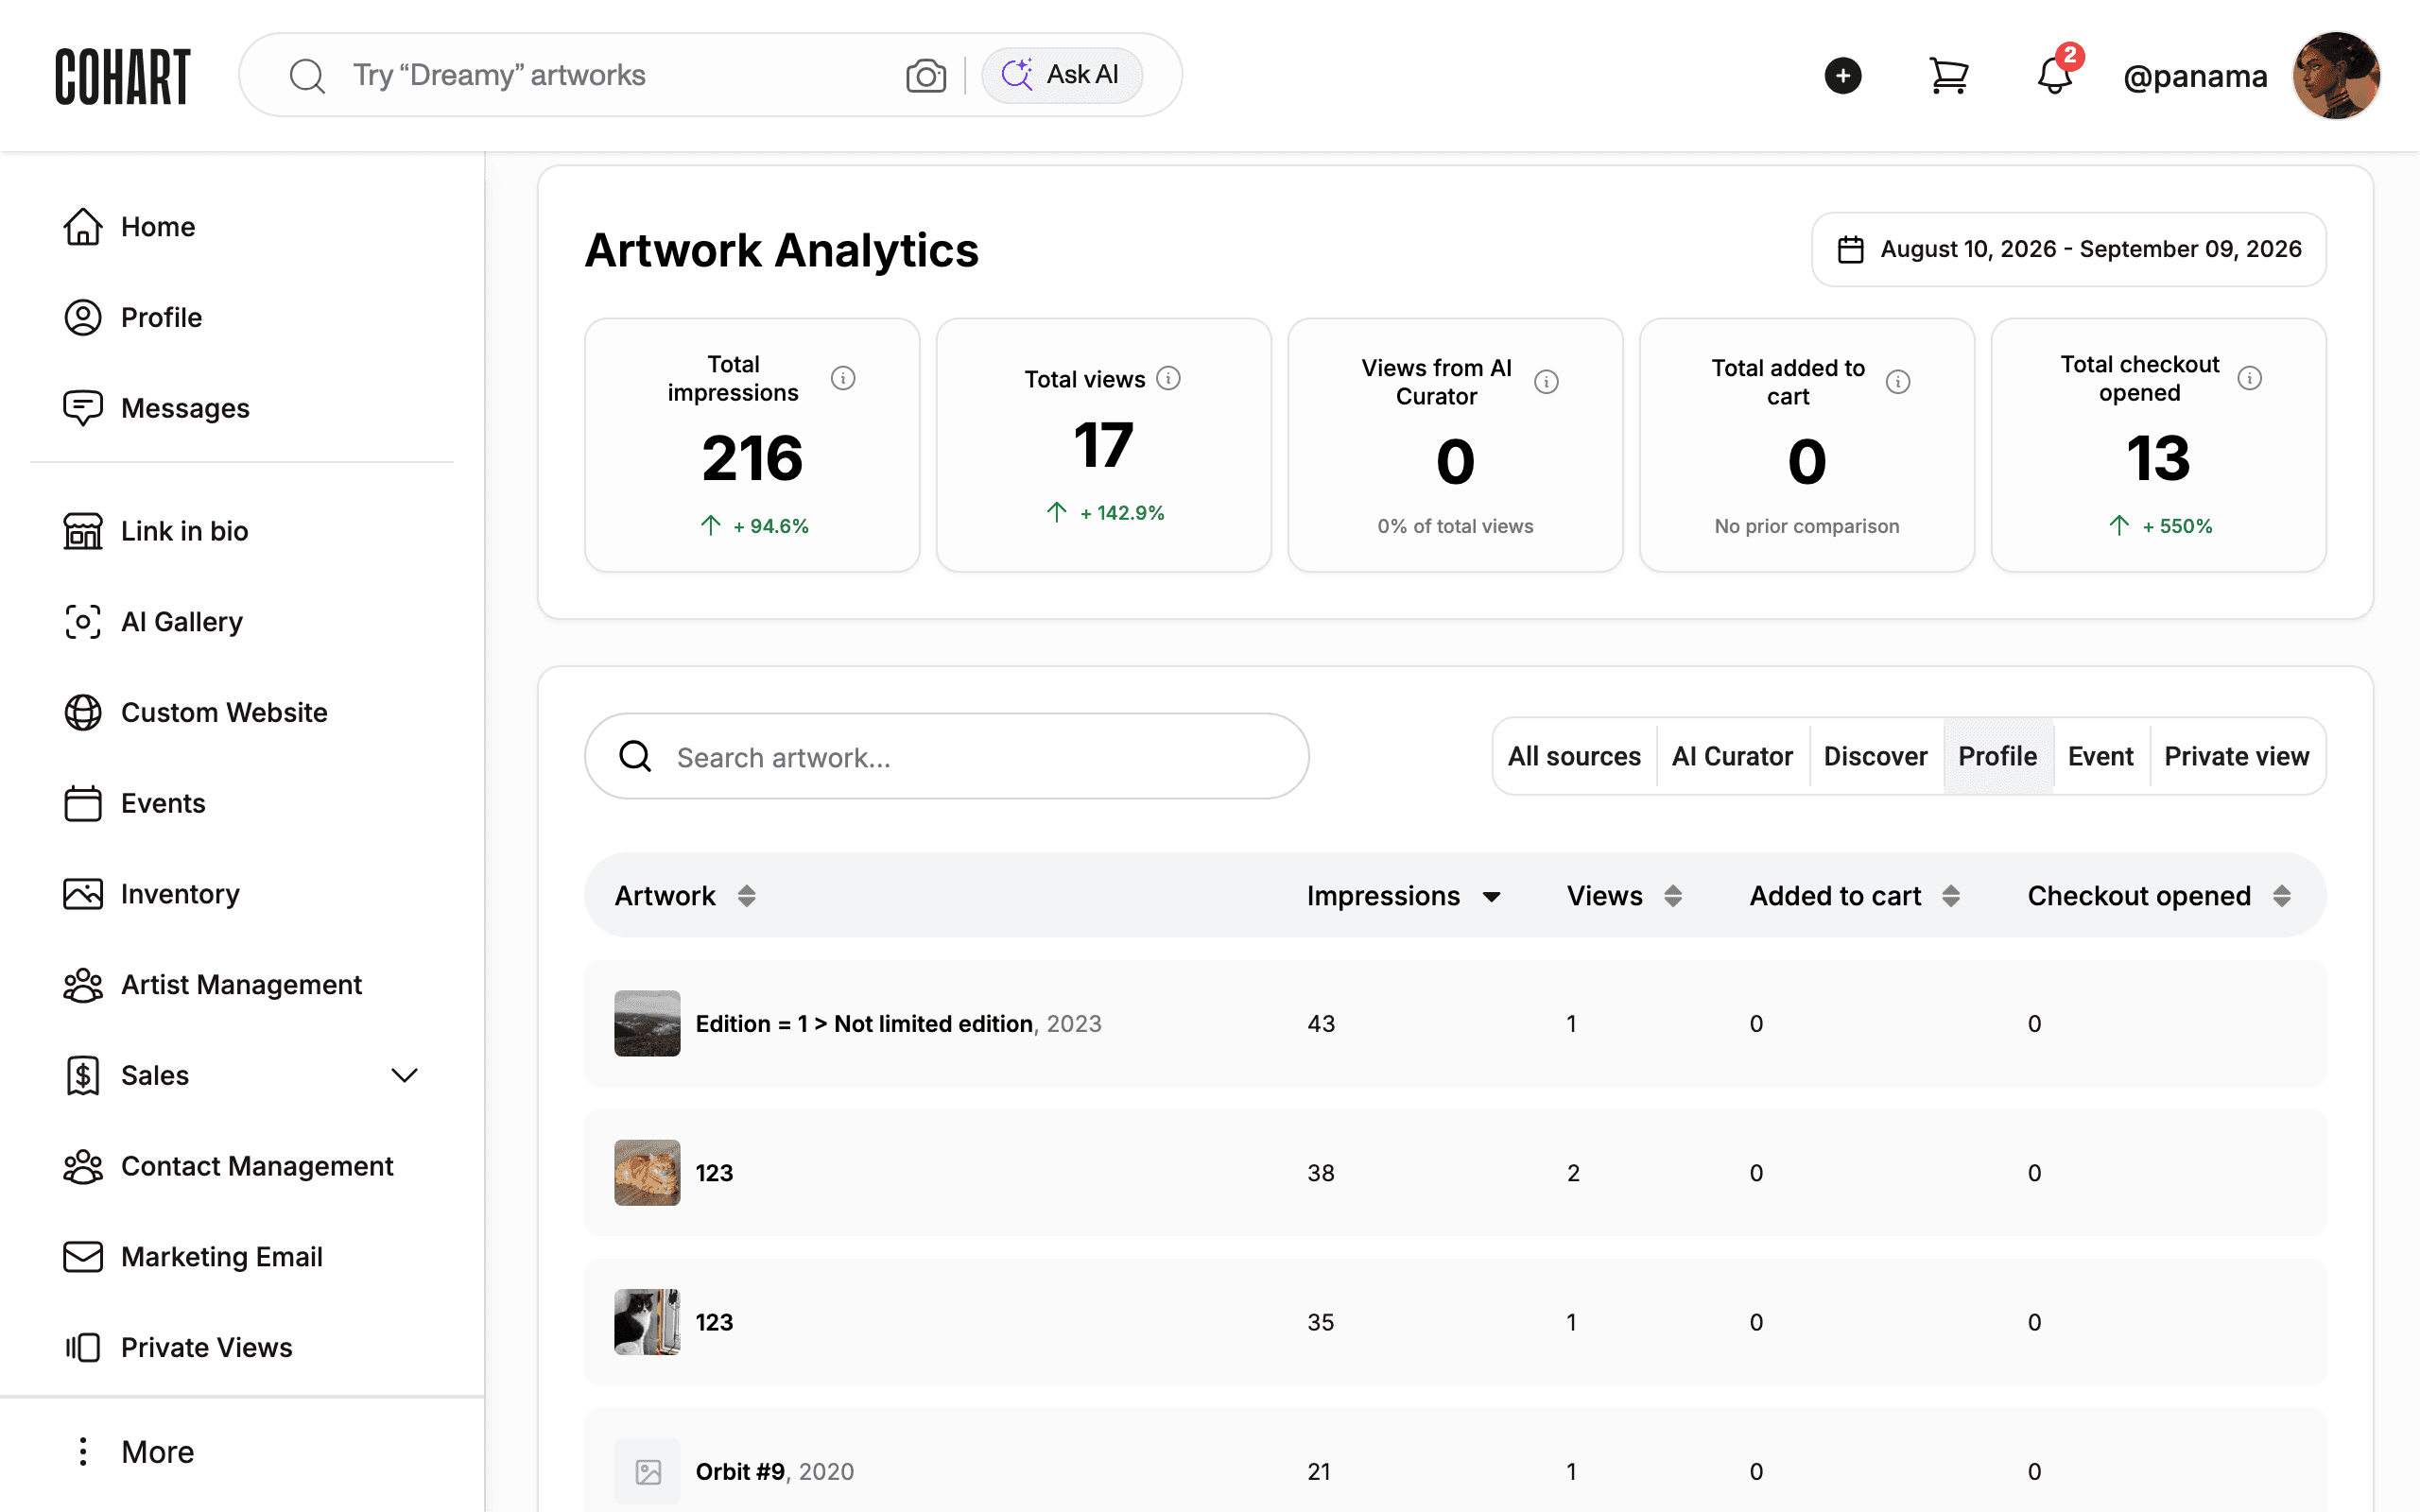
7. Filter by the Profile source
Click the Profile source filter to isolate traffic from your public profile and link-in-bio (for example Total impressions 216, Total views 17). The remaining filters work the same way: Event isolates event storefront views and Private view isolates advisor collections.
8. Reset to All sources
Click All sources to reset the report to the combined totals across every surface. There is no side-by-side view, so record the numbers per filter click to compare two sources.
9. Read the per-artwork table
Read the per-artwork table. Each row shows the Artwork title and year, then four numbers: Impressions (times shown), Views (times opened), Added to cart, and Checkout opened. High checkout-opens with low views (for example 46 impressions, 28 views, 2 cart adds, and 36 checkout opens) can signal strong buying intent.
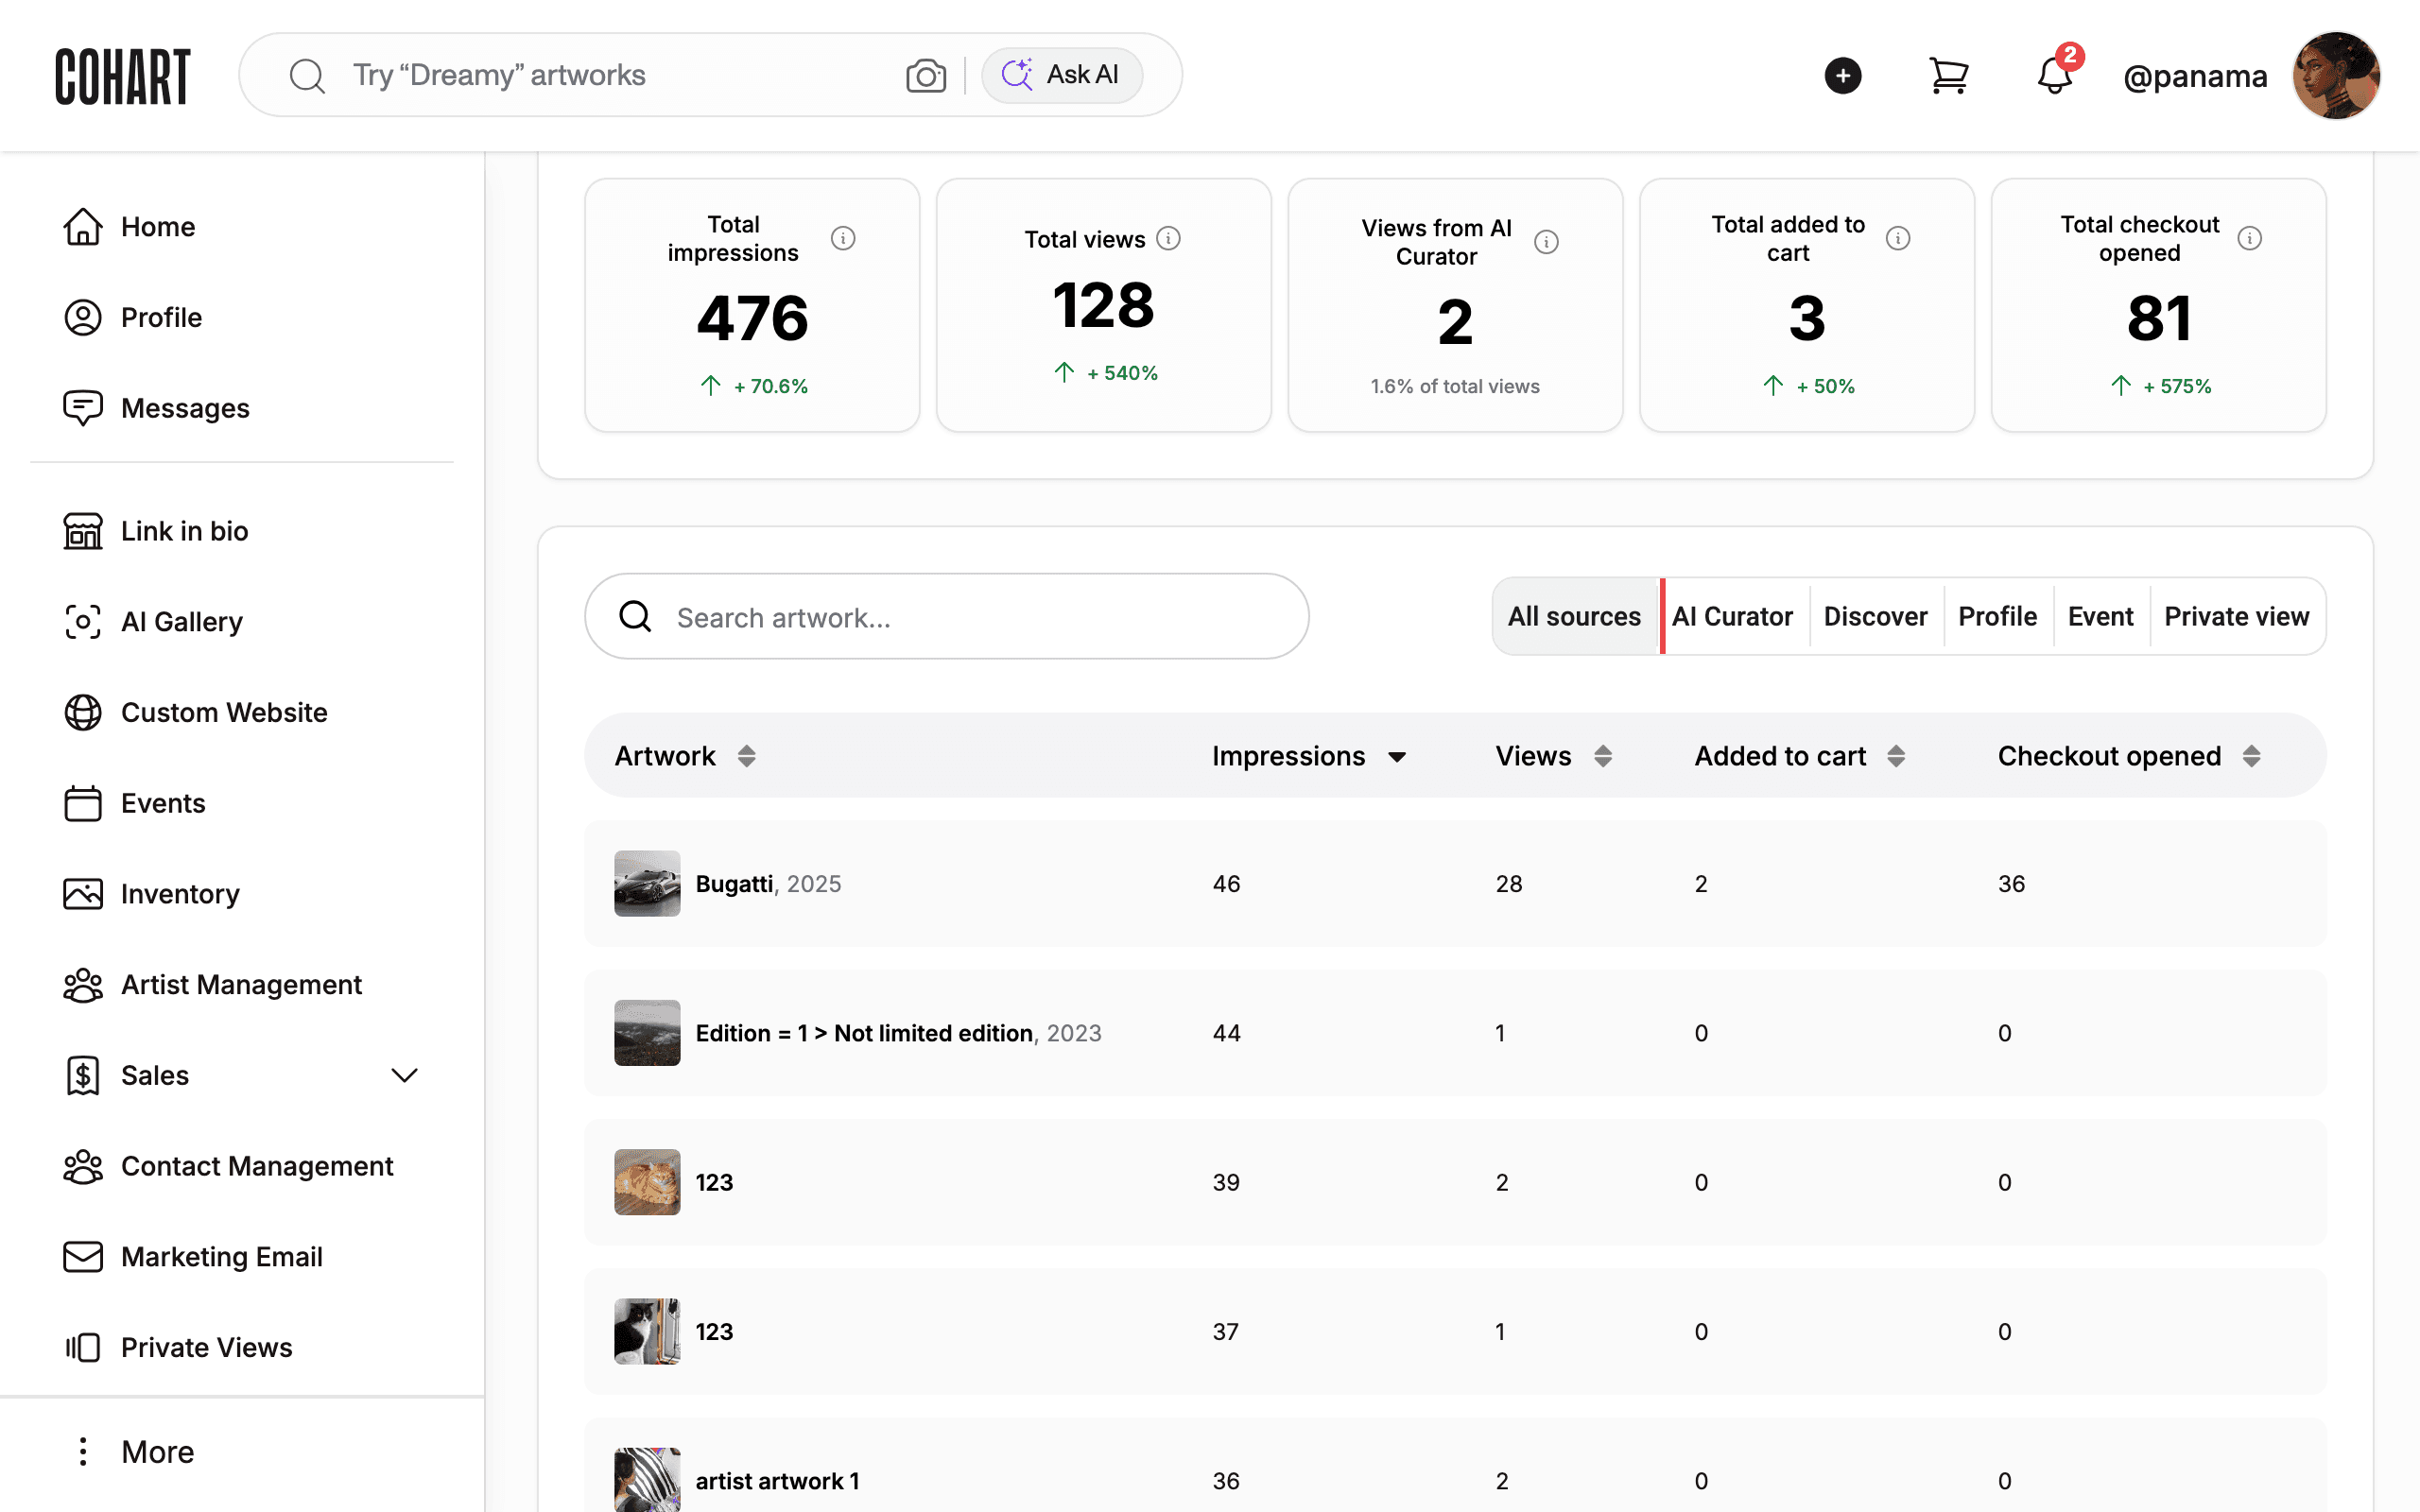
10. Page through the full catalog
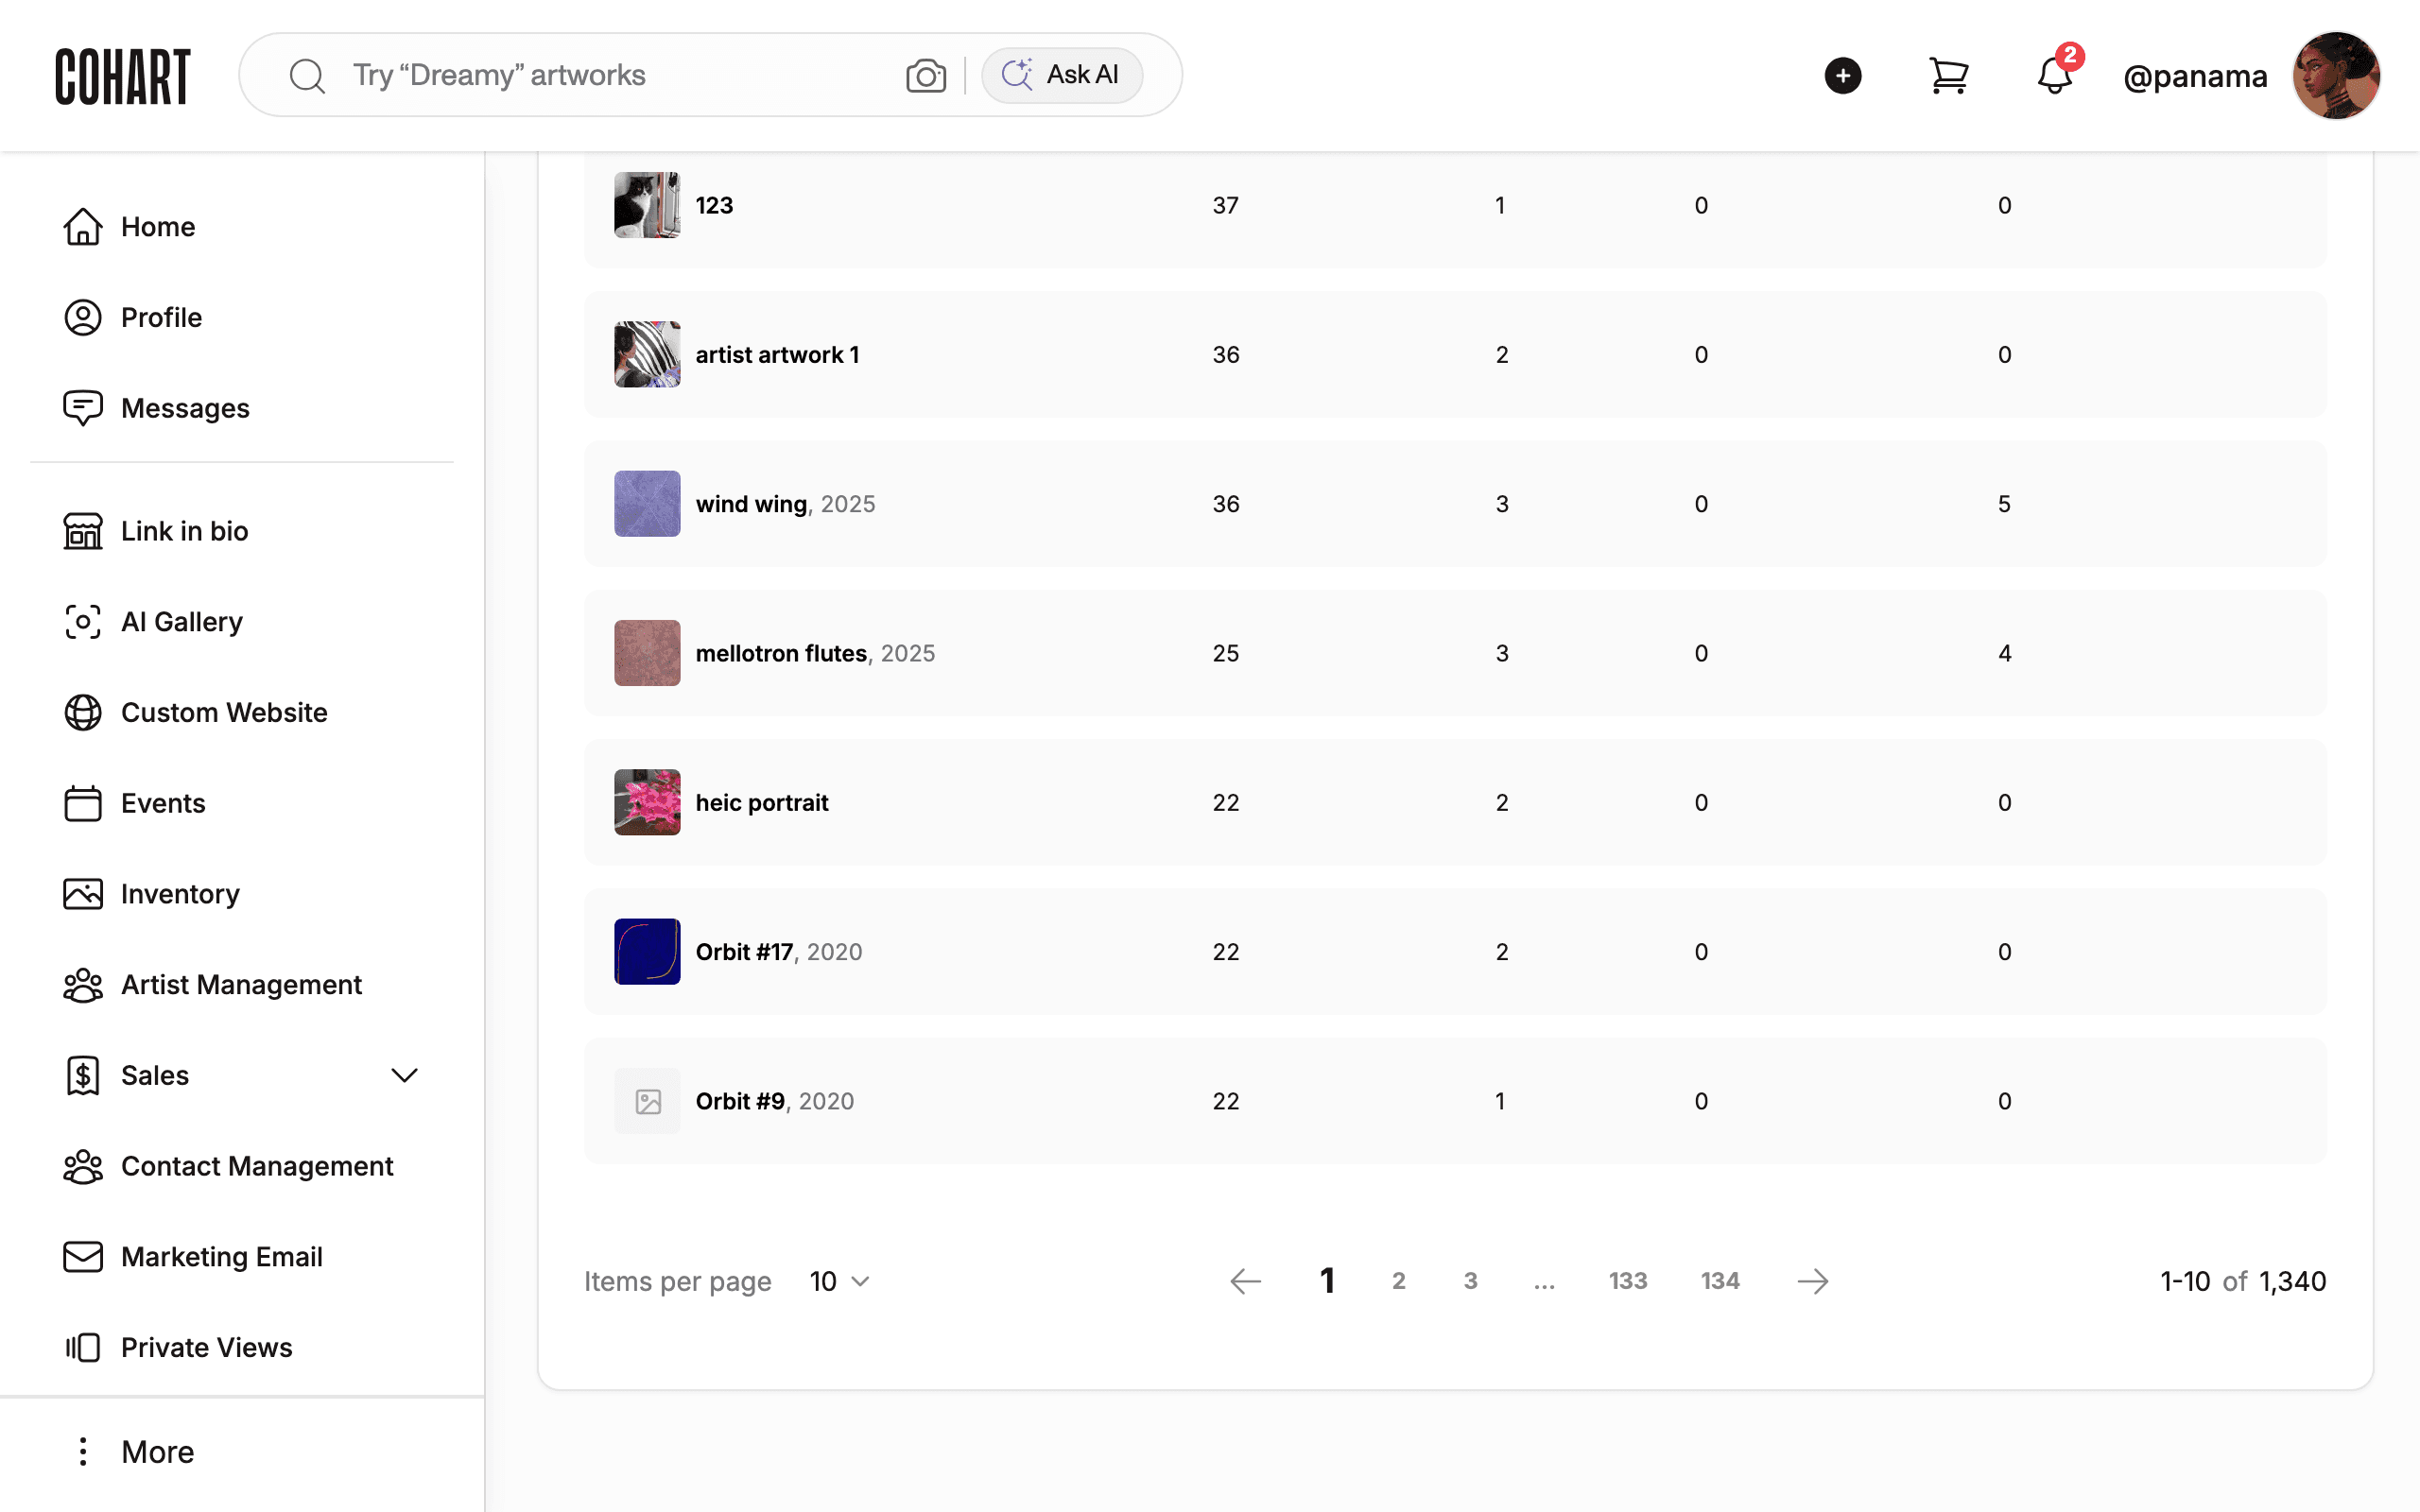
Page through the full catalog with Items per page (default 10) and the numbered pages at the bottom (for example 1-10 of 1,340 across 134 pages). Change the page size before concluding an artwork has no traffic.
Tips
- AI Curator share looks tiny. It is a share of total views (for example 2 views, 1.6% of total). Check All sources before concluding curator traffic is missing.
- No prior comparison. A metric with no history shows No prior comparison instead of a % change. This is normal for new artworks.
- Date window confusion. Every number on the page belongs to the header range. There is no per-row date; use the header range when reporting figures.
Troubleshooting
- The table is empty or shows zeros → the artworks are unpublished or have no views yet → confirm works are listed (not DRAFT) in Inventory first.
- Totals do not change after clicking a filter → the table is still reloading → wait a moment for the totals and rows to update after each click.
- You cannot find Artwork Views → it sits below Admin and above Manage Plan → scroll the sidebar down to reveal it.